Big Picture: Bias is Bullish, Market In Upward Channel From October 2023 Low, $VIX 20-25 (Mild Volatility)
Today´s Pivot is 6139
In the Sunday Post, I reiterated the Bearish divergences from the technical indicators and highlighted how the stock market appeared overextended, which culminated in Friday's selloff. The key question remained was whether the market will consolidate further or face additional downside pressure. In hindsight, the OVN session saw a sharp selloff attributed to China's "groundbreaking" AI model announcement. As with many things in life, only time will reveal how this situation unfolds.
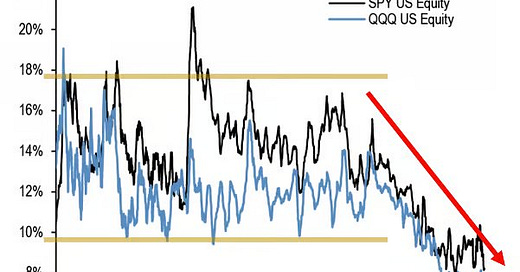
On that note, the chart below provides an interesting perspective on the gradual decline in short interest levels in both the S&P 500 and Nasdaq indices over recent years. A similar trend is evident among individual S&P 500 stocks. This trend helps explain why the market has consistently rebounded after every significant selloff in the past few years. The question now is: Will this phenomenon persist?
h/t:
Market Analysis
Keep reading with a 7-day free trial
Subscribe to PalmaFutures Newsletter to keep reading this post and get 7 days of free access to the full post archives.


