

Sunday Post - Recap & Week Ahead 4/14/2024
Sunday Post - Recap & Week Ahead 4/14/2024

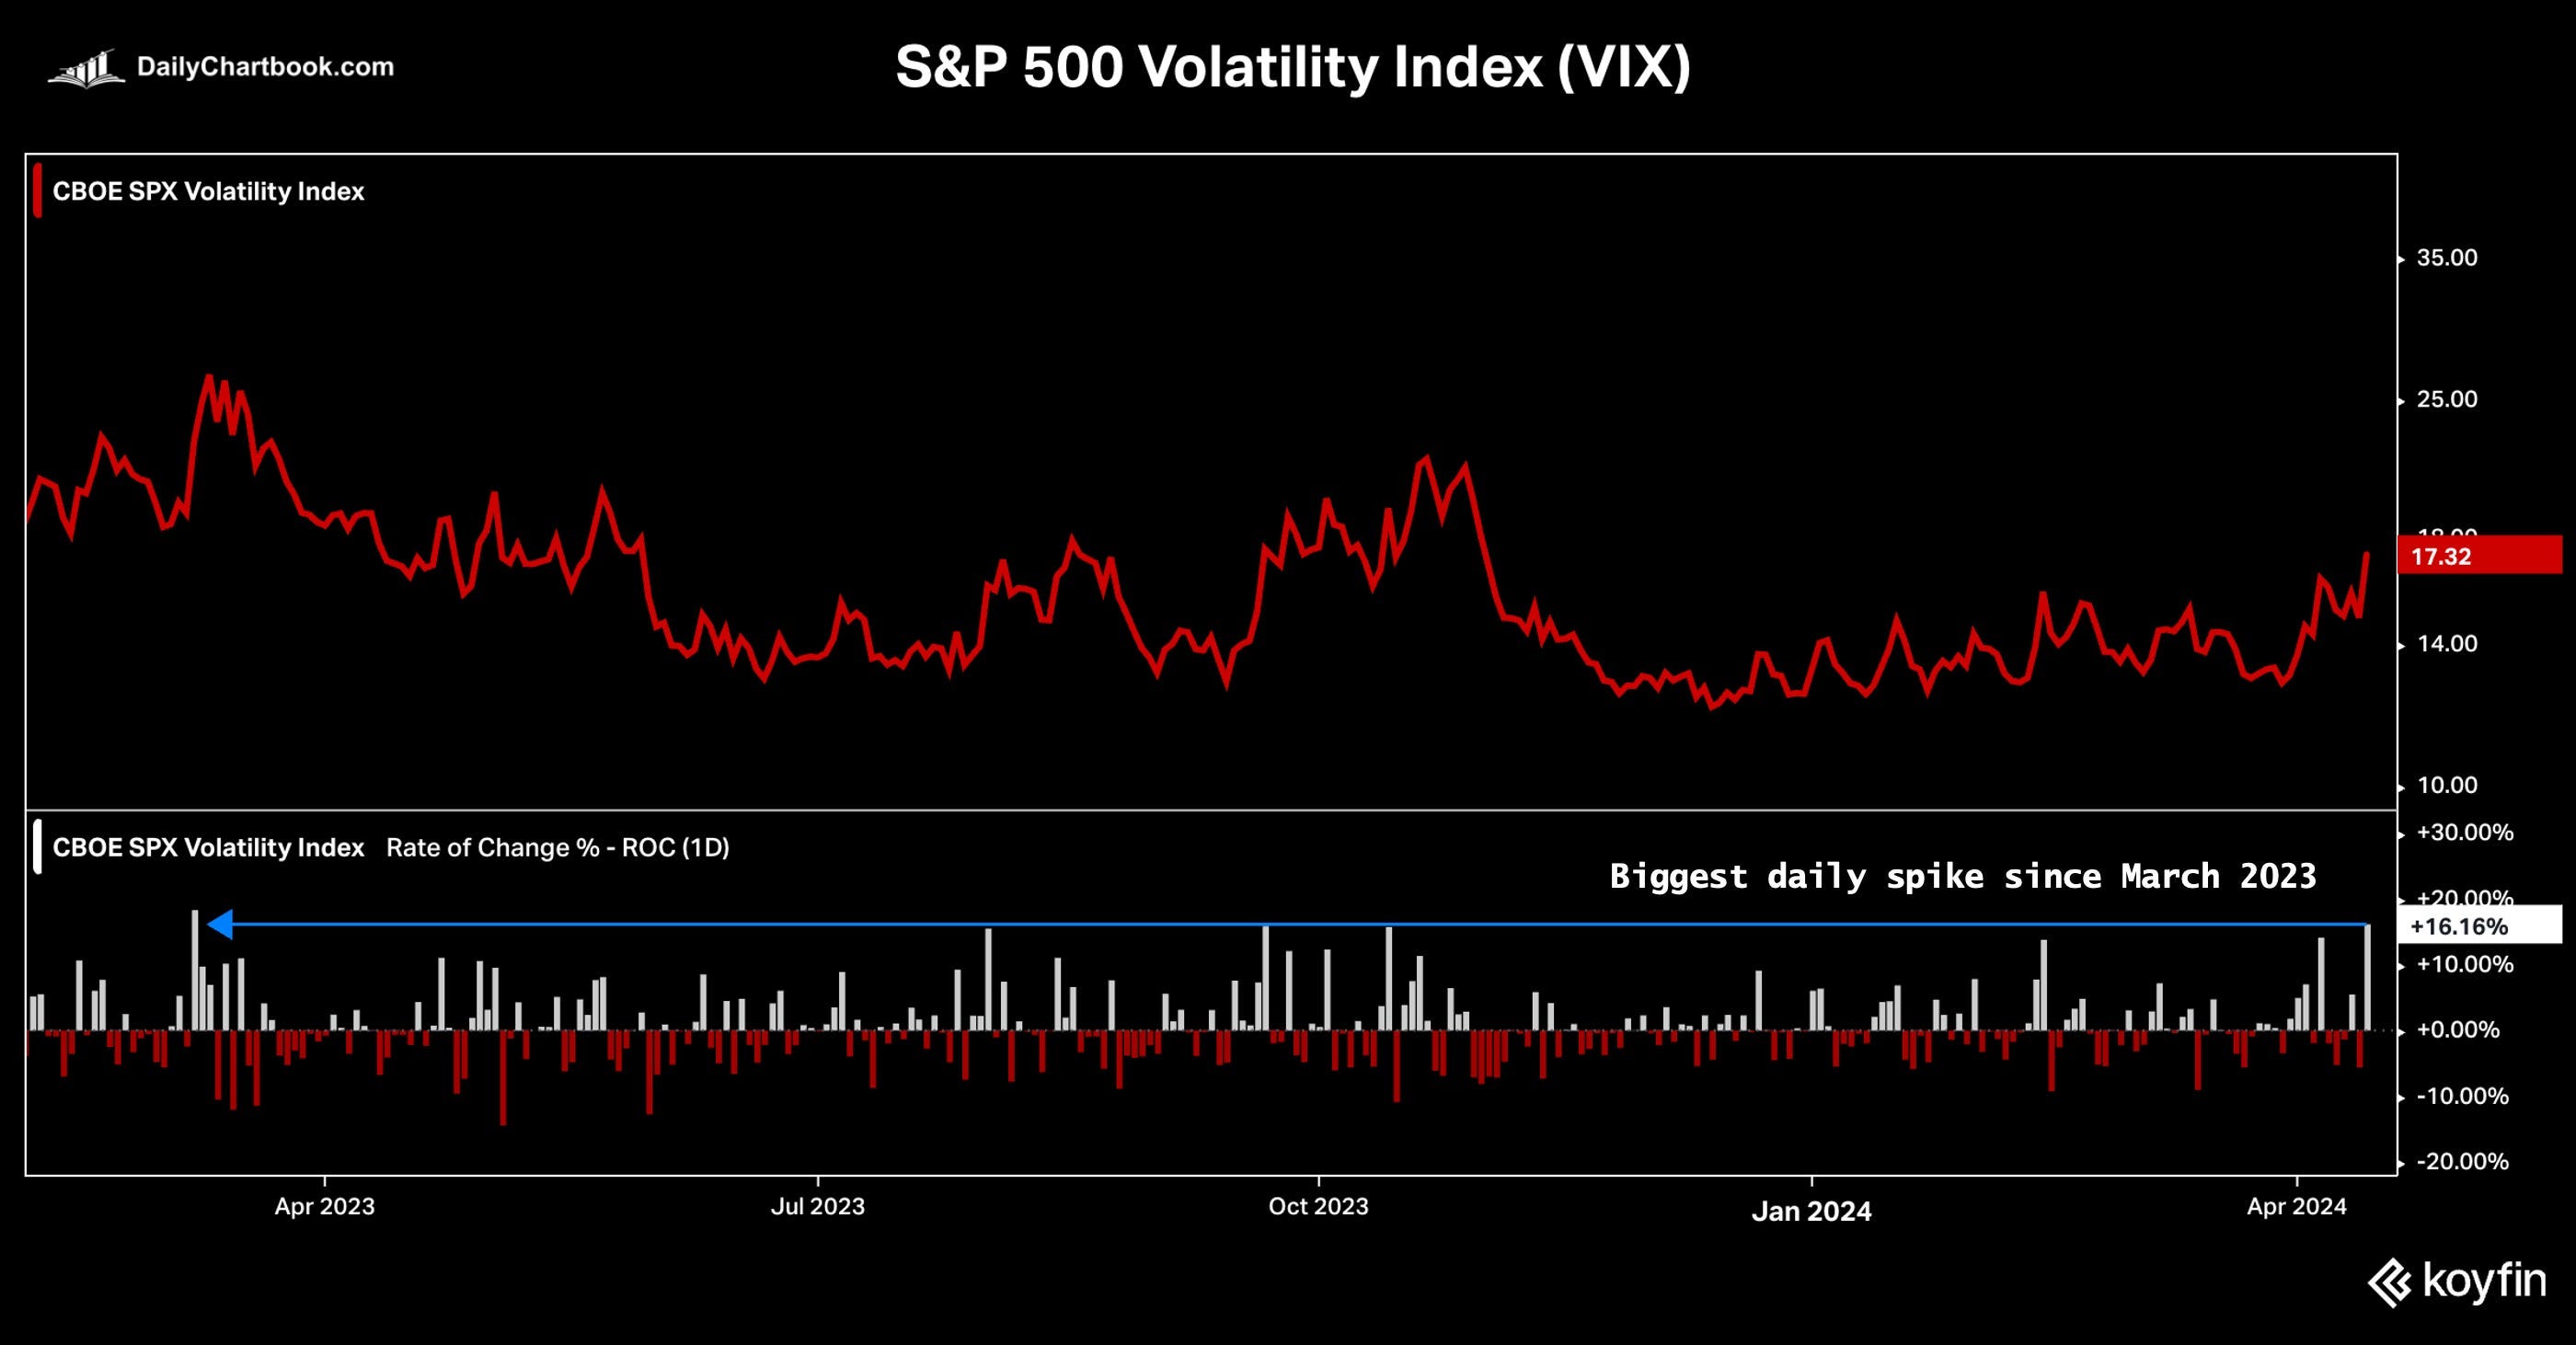
For the second week in a row, the S&P 500 and the Dow Jones retreated 1.6% and 2.4%, respectively while the Nasdaq declined 0.5%. Despite the weakness in recent days, the S&P 500 is just 2% below its all-time high, which is the largest pullback since October of last year. The $VIX surged to a 5-month high after the biggest daily spike since March 2023. See chart below.
h/t:
The ES market failed to reclaim the daily 20 MA after several attempts and then sold off to the daily 50 MA, which was defended at first. However, the market closed slightly below the 50 MA after the big selloff on Friday. See daily chart below. The main focus will be on whether the Buyers are going to reclaim the 50 MA and move the market higher or there will be more selloff.

As usual, I will do a quick recap of this week´s market action, followed by an analysis of the general markets and the different sectors, and finally write about the outlook for next week.
Recap:
Early in the week, the ES market consolidated near the top of the 5-Day Balance as the Buyers and Sellers were battling it out around the daily 20 MA. On Tuesday, the market hit the 5271 level (top of Balance) and sold off towards the bottom of the Balance. The 5208 level was defended and the market rebounded back higher. The following day, the market made an attempt to break above the Balance, but the breakout failed and the market sold off hard breaking below the bottom of the Balance at the 5197 level. The market moved lower to the 5175 level which was near the daily 50 MA. Subsequently, the market consolidated between this area and the bottom part of the 5-Day Balance for some time. The 50 MA was defended again and the market rallied higher on Thursday to the weekly Pivot of 5259/daily 20 MA, which was rejected. The market then sold off hard on Friday breaking below the bottom of the Balance and found support at the 5150 level, which was the last target for the week as per the previous Sunday Post. The Bearish scenario as written in the Sunday Post worked out perfectly. This is what I wrote last week, “the Sellers must defend the weekly Pivot of 5259 and the daily 20 MA for more downside. Once the bottom of the 10-Day Balance at the 5237 level is broken, the downside targets are at the 5225 - 5218 area, the 5208 level, the 5201 - 5197 area and the 5190 level, which are all strong supports and potential turning points. If the Sellers are able to take out the 5190 level, then the next targets are at the 5184 level, the 5175 level, the 5165 level and the 5151 level.”
General Markets and Sectors:
Check out the updated Charts Page which goes with this section.
The S&P 500 sold off to the daily 50 MA, which coincides with the 5111-support level and this area could be defended. Resistance is at 5175 level and next support is at 5030.
The NDX/Nasdaq consolidated this week and the daily 50 MA (around 18000 support) was defended. If this area fails, then the next support is at 17350.
The Dow Jones broke below the daily 50 MA and sold off towards the 37715-support level. This area could be defended and next resistance is at 38220.
Small Caps (IWM) gapped down below the daily 50 MA, as well as broke the big support at 200. This level was the upper limit of the prior rangebound area and must be closely watched. Next major support at 189 (daily 200 MA).
The FFTY index broke below the daily 50 MA and on Friday broke slightly below the upward channel support. If the market fails to move back inside the channel, then the next major support is at the daily 200 MA/the 24 level.
Crude Oil consolidated above the $85 support and if this level holds then next resistance is at $93. Note the daily 50 MA has crossed above the 200 MA.
Gold made another all-time record high and then sold off forming an ugly reversal candle. Support is at 2329.
The US 10-Year yield broke above the 4.40% resistance (now support) and moved higher right to the 4.57% resistance. If the rally continues, then the next resistance is at 4.75%.
The USDJPY broke above the 152 resistance (now support) and the October 2022 high moving towards the 155 resistance. If the gains extend, then the next resistance is at 160 (around the 1990 high).
Bitcoin is currently consolidating between the 73121 level (resistance) and the 64200 level/daily 50 MA (support).
Semis, SOX sold off to the daily 50 MA and moved back inside the upward channel.
Consumer Disc, XLY sold off below the daily 50 MA and could see more lower prices if the 50 MA is not reclaimed.
The Retail sector, XRT broke below the daily 50 MA (now resistance), which also coincides with the upper limit of the prior rangebound area.
The Tech sector, XLK has been consolidating all month and closed slightly below the daily 50 MA. If this MA is not reclaimed could see lower prices.
Transports, IYT broke below the daily 50 MA and is now well inside the upward channel.
Financials sector, XLF sold off and finally broke the uptrend line. This market managed to close below the daily 50 MA.
The Materials sector, XLB sold off moving lower towards the daily 50 MA, which could act as support.
Industrials, XLI sold off after consolidating near the all-time record highs the past few weeks. Next support is at the daily 50 MA.
The Health sector, XLV sold off further down and is moving towards the daily 200 MA.
Consumer Staples, XLP broke below the daily 50 MA and is back-testing the downward channel. Next support is at the daily 200 MA.
Utilities, XLU sold off and back-tested the downtrend line which could act as support. Note the daily 50 MA is crossing above the 200 MA.
The Energy sector, XLE consolidated and then sold off on Friday. It remains Bullish but seems like it has lost some steam.
YEAR-TO-DATE RETURN:
SOX Semiconductor Index: +15.7%
XLE U.S. Energy Sector: +15.6%
XLI U.S. Industrials Sector: +8.1%
XLF U.S. Financial Sector: +6.9%
XLK U.S. Technology Sector: +6.9%
XLB U.S. Materials Sector: +5.5%
IYT Dow Jones Transports: +3.3%
XLP U.S. Consumer Staples Sector: +2.6%
XLV U.S. Health Care Sector: +2.2%
XLU U.S. Utilities Sector: +2.2%
XRT U.S. Retail Industry: -0.4%
XLY U.S. Consumer Disc Sector: -0.7%
Week of 4/14/2024:
United States - retail sales figures, building permits, housing starts, and existing home sales, along with speeches by Federal Reserve officials. The start of the Q1 earnings season will see major companies like Goldman Sachs, Bank of America, J&J, Morgan Stanley, UnitedHealth Group, Blackstone, Taiwan Semiconductor Manufacturing, Netflix, American Express, and P&G reporting their financial results.
China - the Q3 GDP growth rate, industrial production, retail sales, house prices, and fixed asset investments.
UK - inflation rate, unemployment rate, and retail sales.
Inflation data - Canada, New Zealand, South Africa, and Japan.
Foreign trade data - Japan, India, Euro Area, Italy, Spain, and Switzerland.
Germany - ZEW Economic Sentiment indicator.
Australia - labor market figures.
Currently, the Sellers are in control since the ES market is below the weekly Pivot of 5201 and tomorrow´s daily Pivot of 5189. The market is also slightly below the daily 50 MA (5177) and has found support at the 5151 level for now. See hourly chart below. For more upside, the Buyers must reclaim the daily 50 MA and then take out tomorrow´s Pivot of 5189/bottom of the 5-Day Balance (5197 level)/weekly Pivot of 5201. The targets are at the 5208 level, the 5218 - 5225 area, the 5231 - 5237 area and the 5250 - 5257 area (daily 20 MA), which are strong resistances and potential turning points. If the Buyers are able to move the market back above the daily 20 MA, then the next upside targets are at the top of the 5-Day Balance at the 5271 level, the 5283 level (this week´s high) and the 5290 level, which are also strong resistances and potential turning points. Conversely, the Sellers must defend the weekly Pivot of 5201/bottom of the Balance (5197 level)/tomorrow´s Pivot of 5189 and the daily 50 MA for more downside. Then, once the 5151 level (this week´s low) is taken out, the downside targets are at the 5137 level, the 5125 level (prior month low) and the 5111 level, which are strong supports and potential turning points. If the Sellers have traction, the next downside targets are at the 5094 - 5086 area, the 5075 level, the 5064 level and the 5050 level, which are also strong supports and potential turning points. With that said, I will provide an update with my daily thoughts and game plan in tomorrow’s post before market open with additional clues from the OVN session.

PLEASE SEE INTRO POST AND READ DISCLAIMER/INTELLECTUAL PROPERTY