


Sunday Post - Recap & Week Ahead 2/2/2025

NOTE: Free subscribers will continue to receive the weekly Sunday Post, but it will not include the final section with the chart, key levels, and detailed analysis for the upcoming week. Upgrade to a paid subscription to unlock the full Sunday Post and gain exclusive access to subscriber-only daily game plans.
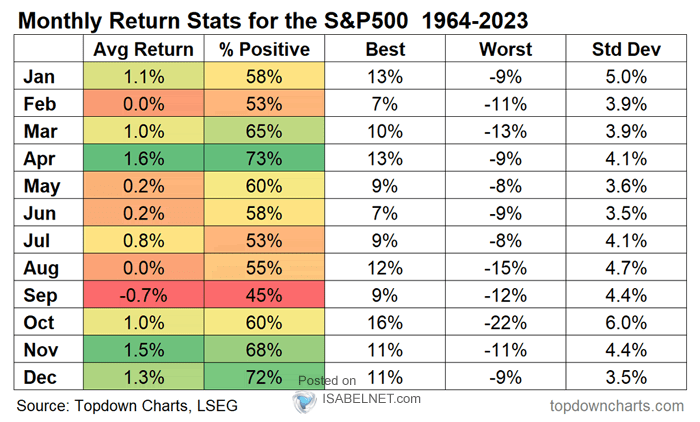
The week began with early-session jitters that eventually gave way to a more cautious sentiment. The S&P 500 declined by about 1.0% and the Nasdaq by roughly 1.6%, while the Dow Jones managed a modest fractional gain over the week. In January, the market enjoyed a strong start: the Dow Jones climbed by more than 4%, the S&P 500 rose by 3% and the Nasdaq gained almost 2%. According to the January Barometer - “As January Goes, So Goes The Year” - a robust performance in January is often seen as an early indicator of a Bullish year ahead. Historically, a strong January has been linked to favorable market performance over the course of the year, whereas a weak January might signal potential challenges ahead. Based on these early gains, expectations for a Bullish 2025 are building. That said, caution remains warranted. February has traditionally been a flat month on average, characterized by volatility and unpredictability. See the table below. In fact, in post-election years, February has historically performed even worse, emerging as the worst month for the S&P 500, Nasdaq and Russell 2000 since 1950.
H/t: IsabelNet
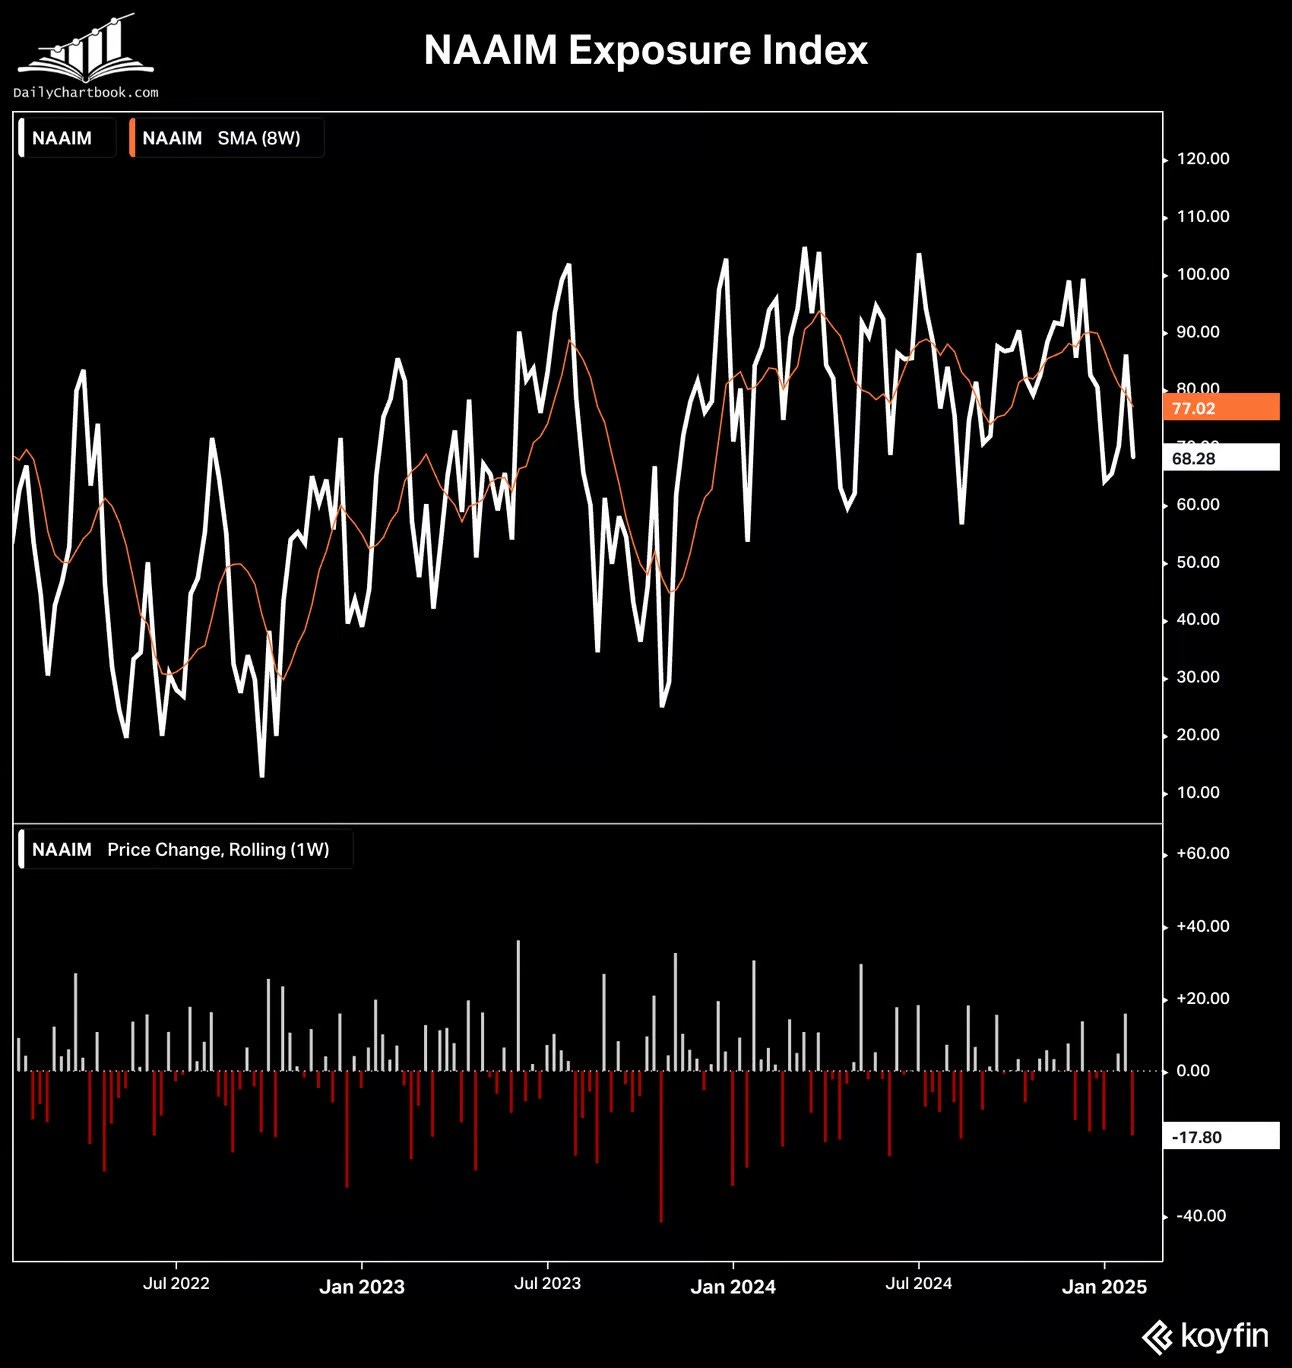
Moreover, the NAAIM Exposure Index fell by the most since August over the past week, dropping to 68 from 86. See the chart below. This index provides insight into the actual adjustments active risk managers have made to client accounts over the past two weeks. Therefore, it represents the average exposure to US Equity markets reported by NAAIM member firms. It is important to recognize that this index is not predictive in nature and should not be used to determine what the stock market will do in the future.
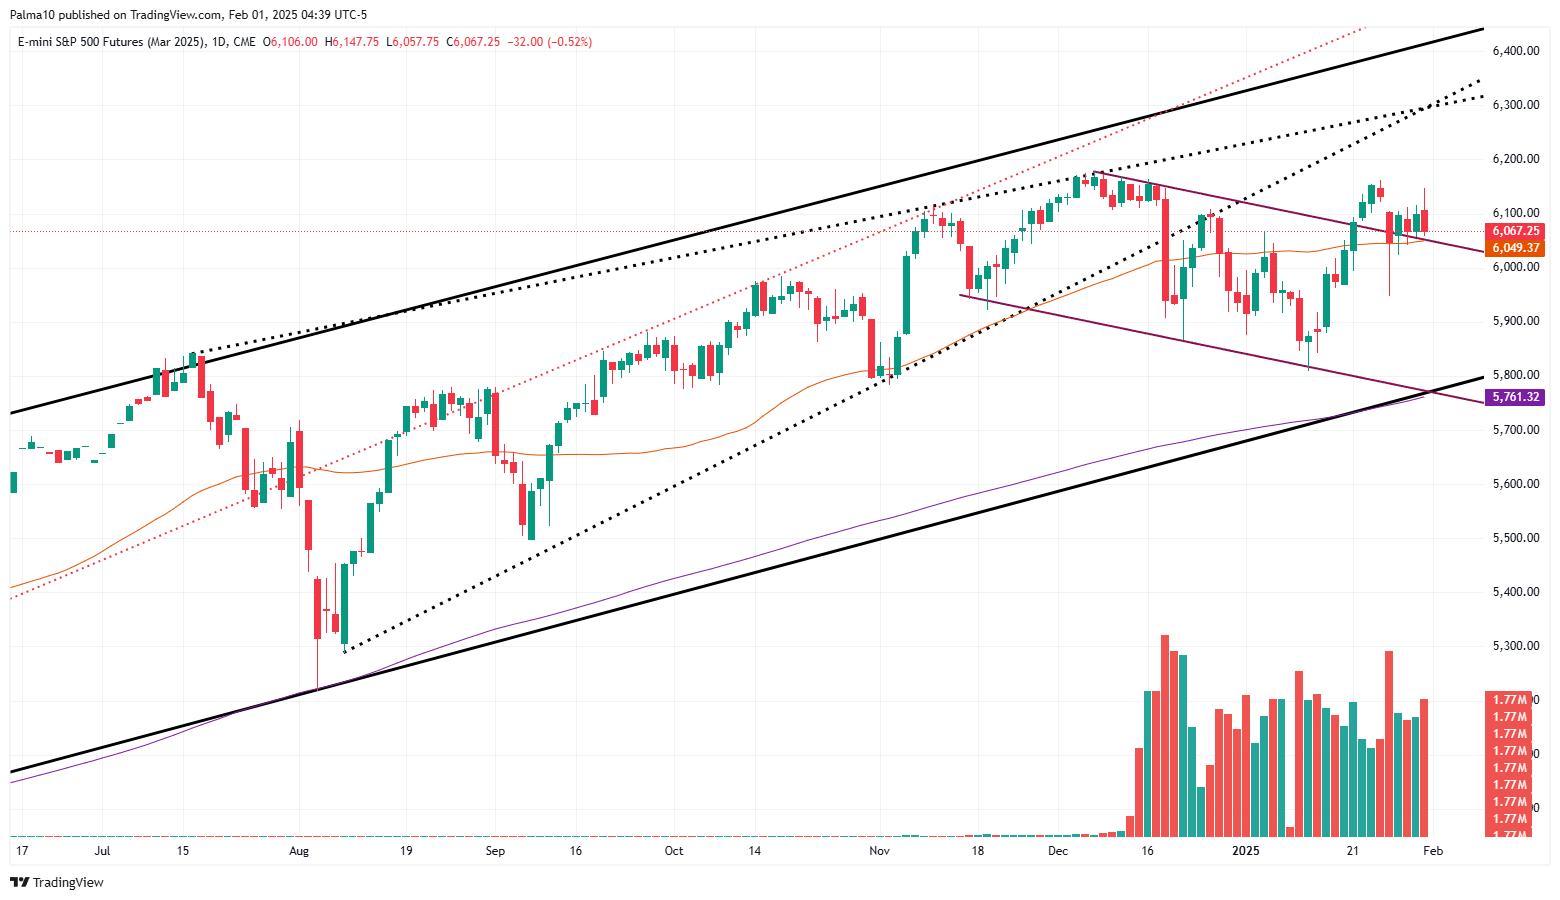
The ES market opened the week with a gap down, retracing into the small downward channel as illustrated in the daily chart below. However, the market later broke above the channel’s resistance and consolidated above the daily 50 MA for the remainder of the week. The back-test of the channel and the daily 50 MA zone - as well as the daily 20 MA (not displayed) - will be important to monitor in the coming week. Note that the market has been rangebound since early November.
As usual, I will do a brief recap of this week´s market action, followed by an analysis of the general markets and the various sectors, and conclude with an outlook for the upcoming week.
Recap:
In the previous Sunday Post, I reiterated the Bearish divergences from the technical indicators and highlighted how the stock market appeared overextended. As a result, the ES market opened on Sunday evening with a gap down, followed by a sharp selloff that met all the outlined downside targets for the week. On Tuesday, the market broke above the downward channel resistance and reclaimed the daily 50 MA, signaling a potential Bullish shift in momentum. However, in the following sessions, price action remained rangebound, with the daily 50 MA serving as a key level of support. On Friday, the market rallied toward the top of the now 11-Day Balance area and successfully filled the Sunday evening gap-down. However, a sudden late-session selloff pushed prices back toward the daily 50 MA area, leaving traders watching this critical level heading into next week.
General Markets and Sectors:
Check out the updated Charts Page which goes with this section.
The S&P 500 gapped down to the daily 50 MA which was defended resulting in a push back higher toward the all-time high. This area was rejected and the market sold off. Resistance is 6090 and support is 6009/daily 50 MA.
The NDX/Nasdaq gapped down moving inside the small downward channel but then rallied back higher breaking the channel resistance and filling the gap. The 21625-support level (now resistance) failed to hold and the market sold off. Support is daily 50 MA and 21171 level.
The Dow Jones has been consolidating near the all-time highs. Support is 44359 and resistance is 45014.
Small Caps (IWM) consolidated around the 227 support and the daily 50 MA, which is acting as resistance.
The FFTY index gapped down breaking the upward channel from the August lows and moved toward the daily 200 MA. The market then rallied higher and made an attempt to move back inside the channel but failed and closed below the daily 50 MA.
The $VIX gapped up and moved back above the 20-level but failed to hold resulting in a selloff that filled the gap. For now, it remains Bearish, but this could change very quickly.
Crude Oil sold off to the $73 level and consolidated in this area with the daily 50 MA holding as support. The daily 200 MA must be reclaimed for the upside.
Gold made a new all-time record high after some consolidation. The 2787 level, which aligns with the previous high, is now support and below here, next support is at the 2720 level.
The US 10-Year yield broke below the 4.57% support (now resistance) and sold off to the daily 50 MA. The market is currently consolidating between these two areas.
The USDJPY sold off and consolidated around the 155 level/daily 50 MA. If this area holds, next resistance is at 157.75, if not, next support is at the daily 200 MA/152 level.
Bitcoin consolidated between the 106175 resistance and the 101275 support/daily 50 MA.
Semis, SOX has been rangebound since August and gapped down to the bottom of this range, which got defended. It remains in an upward channel from the October 2022 low.
Consumer Disc, XLY bounced off the daily 50 MA and remains in the upward channel from the August low.
The Retail sector, XRT broke above the daily 50 MA but then sold off closing below it. It remains in the upward channel from the November 2023 low.
The Tech sector, XLK has been rangebound since November and gapped down to the bottom of this range, which got defended. It remains in the upward channel from the January 2023 low.
Transports, IYT rallied to the upward channel resistance from the October 2022 low but then sold off breaking back below the daily 50 MA.
Financials sector, XLF moved higher and made a new all-time record high. It remains inside the upward channel from the October 2023 low.
The Materials sector, XLB continues to consolidate around the daily 50 MA and failed to close above this MA.
Industrials, XLI gapped down and consolidated above the daily 50 MA. It remains in an upward channel from the March 2020 low.
The Health sector, XLV moved higher and consolidated around the daily 200 MA.
Consumer Staples, XLP gapped up and consolidated around the daily 200 MA/50 MA.
Utilities, XLU consolidated between the daily 50 MA and the 200 MA. It remains in the upward channel for the October 2023 low.
The Energy sector, XLE broke below the daily 200 MA/50 MA after being rejected at the uptrend line from the October 2020 low last week. Note that this market has been rangebound for at least two years (shaded area).
YEAR-TO-DATE RETURN:
DJIA Dow Jones +4.8%
SPX S&P 500 +2.8%
IXIC Nasdaq +1.7%
XLV U.S. Health Care Sector: +6.8%
XLF U.S. Financial Sector: +6.5%
XLB U.S. Materials Sector: +5.5%
XLI U.S. Industrials Sector: +5.0%
IYT Dow Jones Transports: +3.8%
XLY U.S. Consumer Disc Sector: +3.5%
XLU U.S. Utilities Sector: +2.9%
XLE U.S. Energy Sector: +2.3%
XRT U.S. Retail Industry: +0.8%
XLP U.S. Consumer Staples Sector: +0.5%
SOX Semiconductor Index: -0.2%
XLK U.S. Technology Sector: -0.7%
Week of 2/3/2025:
Click link for complete Economic Calendar.
United States - Jobs report, ISM PMIs and megacaps Amazon and Alphabet are set to report quarterly results, along with PepsiCo, AMD, Pfizer, Walt Disney, Qualcomm, Eli Lilly, and Honeywell.
Monetary policy - the RBI is expected to begin its rate-cutting cycle, while the BoE is likely to lower borrowing costs by 25 bps.
GDP growth figures - Indonesia and Hong Kong.
Additionally, global PMIs, Eurozone inflation, German factory orders, and Canadian employment data will also be in focus.
Keep reading with a 7-day free trial
Subscribe to PalmaFutures Newsletter to keep reading this post and get 7 days of free access to the full post archives.