Sunday Post - Recap & Week Ahead 5/25/2025
Stock Market Analysis and Insights, Charts and Levels
PLEASE SEE INTRO POST AND READ DISCLAIMER & INTELLECTUAL PROPERTY SECTIONS
NOTE: Free subscribers will continue to receive the weekly Sunday Post, but it will not include the final section with the chart, key levels, and detailed analysis for the upcoming week. Upgrade to a paid subscription to unlock the full Sunday Post and gain exclusive access to subscriber-only daily game plans.
US equities declined across the board for the week, amid rising bond yields and a credit rating downgrade. The S&P 500 fell 2.6%, the Nasdaq dropped 2.5%, the Dow Jones declined 2.5%, and the small-cap Russell 2000 lost 3.5%, reflecting a broad-based retreat in the market. All sectors posted losses, with Energy and High Beta stocks hit hardest, while Blockchain and commodity miners outperformed. Investors moved toward safer assets amid economic uncertainty. Gold surged over 5% for the week, while the US dollar weakened against major currencies and bonds retreated.
Market sentiment turned cautious - the VIX spiked to a two-week high, reflecting increased market volatility. The AAII Bullish sentiment reading rose to 37.7%, slightly above its historical average of 37.5%, while the CNN Fear & Greed Index hovered in "Greed" territory at 64, indicating a moderate level of investor optimism. Bond yields surged: The 10-Year Treasury yield rose to 4.508%, and the 30-Year Treasury yield spiked to 5.036%, nearing its 2023 peak. Bitcoin (BTC) gained 2.6% on the week, with modest capital inflows signaling improving risk sentiment in digital assets.
Overall, the combination of declining equities, sector-wide losses, increased demand for safe-haven assets, cautious investor sentiment, and rising bond yields paints a picture of a market grappling with renewed economic uncertainties.
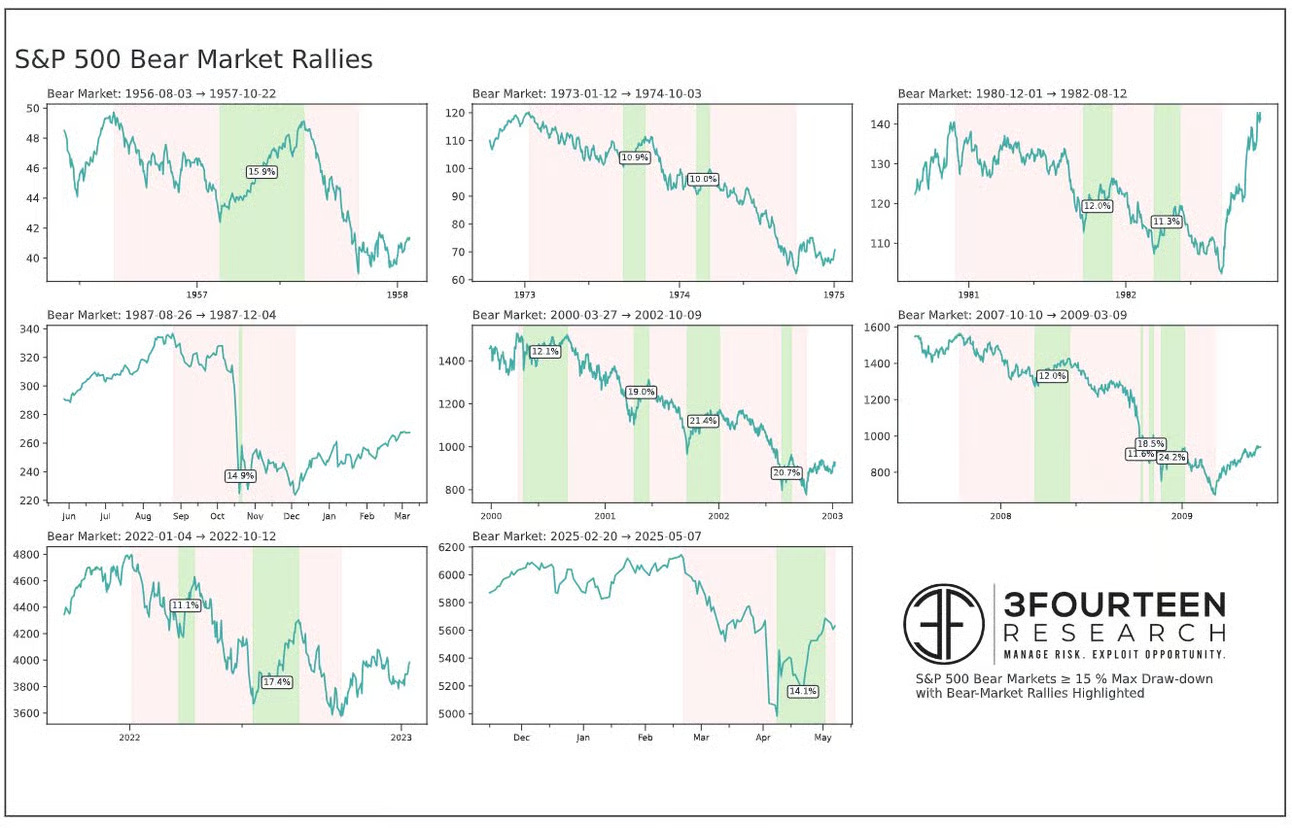
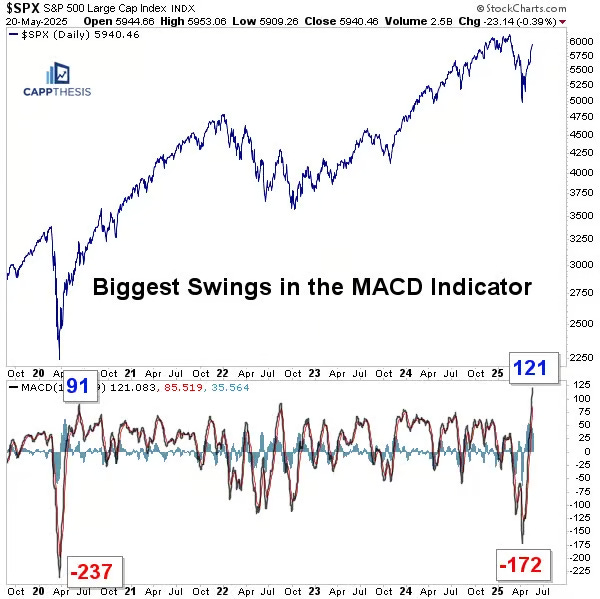
Here are two interesting data points to consider. On one hand, the S&P 500 is up roughly 20% from its April low. If this turns out to be a Bear market rally, it would rank as the fourth largest on record—see the first image below. On the other hand, the S&P 500’s MACD indicator recently surged from the second-lowest level ever to its highest reading on record in an exceptionally short time—see the second image. The last time a similar move occurred, it was followed by a powerful market rally to new highs and beyond.
h/t:
Last Sunday, I noted that the ES market was approaching the resistance of its upward channel from the April lows and given the overbought conditions, there was an elevated risk of a short-term pullback. That scenario played out this week, with the market selling off and breaking below both the daily 200 MA and the key support level around 5845. The market did bounce off the 20 MA (not shown in the daily chart below), so the key question now is whether the 20 MA continues to hold, allowing the market to reclaim the 200 MA. If it fails to do so, we could see further downside, likely targeting the daily 50 MA.
As usual, I will do a brief recap of this week´s market action, followed by an analysis of the general markets and the various sectors, and conclude with an outlook for the upcoming week.
Recap:
The ES market began the week with a selloff, breaking below a key support area and fulfilling the downside condition outlined in the prior Sunday Post. Price action then moved directly to the weekly Pivot of 5896, which marked the second downside target from that analysis. The market subsequently reversed and rallied to the first upside target, but the Buyers lacked momentum, and the market sold off again on Tuesday. Price action stalled midweek, entering a Balance phase. On Wednesday afternoon, the bottom of the 3-Day Balance range (the weekly Pivot) was broken, and the market found support at the 5845 level—below the daily 200 MA. The market then consolidated around this area, but during that time, the Buyers failed to reclaim either the 200 MA or the weekly Pivot, signaling ongoing weakness.
On Friday, the market sold off sharply, hitting and surpassing all of the downside targets outlined in last Sunday´s analysis. It eventually found support around the daily 20 MA area and rebounded toward the previous support at 5845, which now acted as resistance and rejected the rally into the close. Overall, the market appears to be pausing after the strong rally that began in early April and is currently trading in a battleground zone that must be resolved before the next directional move can unfold.
Stock/ETF Swing Trades:
Here’s an update on the two recent stock purchases that were shared with paid subscribers at the time of entry. I sold half of my position in SMR 0.00%↑(bought May 13) for a 30% profit, as it approached its all-time high. While APP 0.00%↑ (bought May 19) has pulled back slightly since then, it remains above my defined risk range and is currently consolidating.
General Markets and Sectors:
Check out the updated Charts Page which goes with this section.
The S&P 500 sold off to the daily 200 MA (5762 support level) which is holding for now. Next resistance is at 5870 and next supports are at 5638, then daily 50 MA.
The NDX/Nasdaq sold off moving toward the upward channel support from the December 2022/January 2023 lows and the 20675 key support area. Next support is at the rising daily 200 MA and resistance is at 21171.
The Dow Jones got rejected at the 42700 resistance, which coincides with the downtrend line from the all-time high and sold off breaking below the daily 200 MA. It has found support near the 41198 level which is slightly above the 50 MA. Resistances are at 41915 and then the 200 MA.
Small Caps (IWM) got rejected at the downward channel resistance from the November 2024 high, which is near 212 - a key resistance level. It sold off to the 200-support level and daily 50 MA.
The FFTY index consolidated above the daily 200 MA (now support) and remains inside the upward channel from the October 2023 low.
The $VIX moved higher since it was quite oversold and broke above the 20 level. However, it pulled back from its high and remains technically weak which reflects a generally Bullish environment for equities.
Crude Oil got rejected at the daily 50 MA and consolidated. If the 50 MA is reclaimed, next resistances are at the downward channel resistance from the March 2022 high and the $67 level and. Support is at $58.
Gold defended the 3210 support and the back-test of the upward channel from the February 2024 low. Then moved higher and broke above the 3138 resistance (now support). Next resistance is at 3424.
The US 10-Year broke above the 4.57% resistance, which got rejected and sold off toward the 4.40% support. It remains in the downward channel from the October 2023 high.
The USDJPY sold off breaking below the 145 support (now resistance, along with the daily 50 MA) and moving toward the 141.75 support. It remains Bearish since the July 2024 highs.
Bitcoin broke above the upward channel resistance from the October 2023 low and made a new all-time high. It got rejected at a long-term resistance line and sold off to the 106175 support (aligns with the back-test of the upward channel).
Semis, SOX got rejected at the daily 200 MA and sold off breaking the upward channel support from the October 2022 low. However, it still remains in the downward channel from the July 2024 high.
Consumer Disc, XLY sold off toward the daily 200 MA and remains in the upward channel from the December 2022 low.
The Retail sector, XRT sold off and moved back below the daily 200 MA and the 75 resistance. It is currently trading in this area, which coincides with the downward channel resistance from the December 2024 high.
The Tech sector, XLK sold off breaking the upward channel support from the October 2022 low once again and moving to the daily 200 MA.
Transports, IYT got rejected at the daily 200 MA and sold off toward the 50 MA. It remains in the upward channel from the October 2022 low.
Financials sector, XLF sold off breaking back below a long-term resistance line and moving toward the daily 50 MA.
The Materials sector, XLB consolidated around the downward channel resistance from the October 2024 high. However, it remains within a long-term upward channel.
Industrials, XLI pulled back slightly from the all-time record highs. It remains in the upward channel from the March 2020 lows.
The Health sector, XLV has been consolidating near the downward channel support from the September 2024 high.
Consumer Staples, XLP continues to consolidate around the daily 200 MA/50 MA and remains within the upward channel from the October 2023 low.
Utilities, XLU moved back down toward both the daily 200 MA/50 MA and the upward channel support from the October 2023 low.
The Energy sector, XLE has been rangebound for over two years (shaded area) and pulled back from the daily 50 MA.
YEAR-TO-DATE RETURN:
SPX S&P 500 -0.8%
DJIA Dow Jones -1.6%
IXIC Nasdaq -2.7%
XLU U.S. Utilities Sector: +7.9%
XLI U.S. Industrials Sector: +7.2%
XLP U.S. Consumer Staples Sector: +4.4%
XLF U.S. Financial Sector: +3.9%
XLB U.S. Materials Sector: +2.3%
XLK U.S. Technology Sector: -2.3%
IYT Dow Jones Transports: -3.2%
XLE U.S. Energy Sector: -3.5%
XLV U.S. Health Care Sector: -4.9%
XLY U.S. Consumer Disc Sector: -5.9%
XRT U.S. Retail Industry: -5.9%
SOX Semiconductor Index: -6.4%
Week of 5/26/2025:
Click link for complete Economic Calendar.
United States - personal income & spending, the PCE price indices, durable goods orders, goods trade balance, 2nd estimate of Q1 GDP growth, corporate profits, pending home sales and S&P/Case-Shiller Home Price Index.
South Korea and New Zealand - monetary policy decisions.
Germany - GfK consumer confidence.
Japan - industrial production, retail sales, and consumer confidence figures.
Inflation figures - France, Spain, Italy, and Germany.
Q1 GDP readings - Turkey, India, Brazil, and Canada.
Market Analysis
Keep reading with a 7-day free trial
Subscribe to PalmaFutures Newsletter to keep reading this post and get 7 days of free access to the full post archives.


