


Sunday Post - Recap & Week Ahead 12/8/2024

NOTE: Free subscribers will continue to receive the weekly Sunday Post, but it will not include the final section with the chart, key levels, and detailed analysis for the upcoming week. Upgrade to a paid subscription to unlock the full Sunday Post and gain exclusive access to subscriber-only daily game plans.
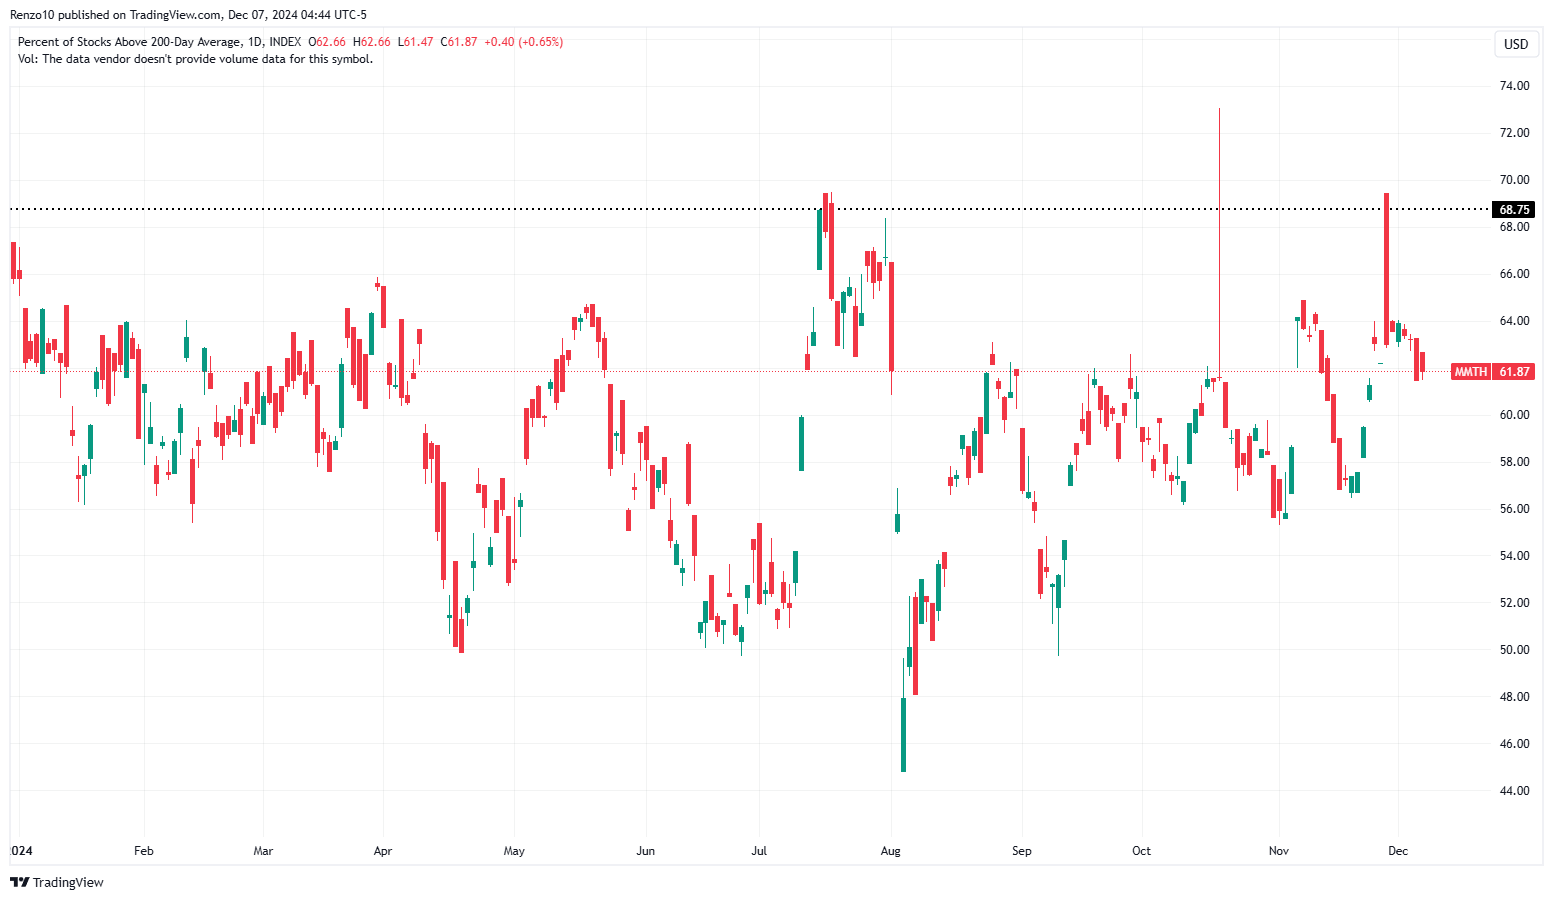
The S&P 500 advanced 1%, continuing its Bullish momentum and achieving a new all-time high. The Nasdaq rose approximately 3.4% during the week, marking its third consecutive weekly gain and also reaching record levels. Meanwhile, the Dow Jones closed the week slightly lower, declining 0.5%, as financials and energy stocks weighed on the index. Investor sentiment remained broadly positive and market breadth has reached levels that often precede significant market movements. Recently, the percentage of S&P 500 stocks trading above their daily 200 MA has climbed into a range historically associated with heightened market vulnerability. Similar to the pattern observed in July, when this metric hit comparable levels, the market subsequently experienced a pullback. See chart below.
As shown in the daily chart below, the ES market continues to set new all-time highs and has now reached the upward channel resistance originating from the October 2023 low (indicated by the blue dashed lines). Currently, the market has encountered resistance at this level, failing to decisively break through. This pattern is reminiscent of similar instances in July and November, where the index tested this resistance and subsequently faced selloffs. Traders should monitor this technical level closely, as a breakout or a rejection could signal the next directional move.

As usual, I will do a brief recap of this week´s market action, followed by an analysis of the general markets and the various sectors, and conclude with an outlook for the upcoming week.
Recap:
Early in the week, the weekly Pivot of 6029 was not breached, a key level for the Buyers to sustain upside momentum as discussed in the prior Sunday Post. As a result, the ES market climbed to a new all-time high. Then, the top of the prior 4-Day Balance from early to mid-November was defended. This defense indicated underlying strength, prompting a rally to additional highs on Wednesday and Thursday, culminating in a test of the upward channel resistance depicted in the daily ES chart above. On Friday, the market made another attempt to break above this channel resistance but failed to do so, ultimately closing below the resistance level. As highlighted throughout the week, this strong resistance zone could act as a barrier, potentially leading to consolidation or a pullback in the coming sessions.
General Markets and Sectors:
Check out the updated Charts Page which goes with this section.
The S&P 500 reached another all-time record high and 6009 is now support.
The NDX/Nasdaq broke above the 21171 resistance (now support) and made a new all-time high. Also, broke above the upward channel resistance from the January 2023 low.
The Dow Jones is consolidating at the all-time highs and 44359 is now support.
Small Caps (IWM) moved slightly lower after making an all-time record high last week. Resistance is at 243 and support is at 234.
The FFTY index moved higher after some consolidation and is approaching the June 2022 highs.
The $VIX sold off further and broke below the recent lows. It remains Bearish for now.
Crude Oil got rejected at the daily 50 MA and sold off breaking below the long-term support line once again. It is back to the $67 support one more time which has been holding strongly since September. If this area fails, next support is at $58.
Gold consolidated between the 2672 resistance/daily 50 MA and the 2605 support. For the upside to resume, it must reclaim the 50 MA.
The US 10-Year yield sold off breaking below the 4.21% support/daily 200 MA/50 MA after some basing in this area. If this zone is not reclaimed, it could continue to move lower to the 4.0% support. It is currently trading inside the downward channel from the October 2023 high.
The USDJPY sold off to the next support at 148.50 which was quickly defended. It is currently basing around the 150 support right below the daily 50 MA. Next resistance area is at the daily 50 MA/200 MA/152 level.
Bitcoin made more new highs but then sold off and back-tested the upward channel that was broken. The 94375-support has been holding and if the rally resumes, next resistance is around 105,500.
Semis, SOX has been rangebound since August and broke above the daily 200 MA. It remains in an upward channel from the October 2022 low.
Consumer Disc, XLY reached another all-time record high.
The Retail sector, XRT consolidated at the February 2022 highs. It remains in an upward channel from the November 2023 low.
The Tech sector, XLK gapped up and made a new all-time record high. It remains in the upward channel from the January 2023 low.
Transports, IYT sold off towards the daily 50 MA and has now moved back inside the upward channel from the October 2022 low.
Financials sector, XLF moved slightly lower from the all-time high. It remains in the upward channel from the October 2023 low.
The Materials sector, XLB broke below the daily 50 MA and moved to the 200 MA. It remains in the upward channel from the October 2022 low.
Industrials, XLI moved slightly down from the all-time record high.
The Health sector, XLV got rejected at the daily 200 MA and sold off. Note the daily 50 MA about to cross below the 200 MA.
Consumer Staples, XLP consolidated near the steeper upward channel support (blue line).
Utilities, XLU got rejected at the long-term upward channel resistance and sold off breaking below the daily 50 MA.
The Energy sector, XLE sold off to the uptrend line from the October 2020 low and broke below the daily 50 MA/200 MA.
YEAR-TO-DATE RETURN:
IXIC Nasdaq +33.2%
SPX S&P 500 +29.3%
DJIA Dow Jones +20.6%
XLF U.S. Financial Sector: +35.6%
XLY U.S. Consumer Disc Sector: +31.0%
XLU U.S. Utilities Sector: +28.7%
XLK U.S. Technology Sector: +25.8%
XLI U.S. Industrials Sector: +24.5%
SOX Semiconductor Index: +23.4%
XLP U.S. Consumer Staples Sector: +16.7%
XRT U.S. Retail Industry: +16.6%
XLE U.S. Energy Sector: +11.2%
IYT Dow Jones Transports: +10.1%
XLB U.S. Materials Sector: +8.8%
XLV U.S. Health Care Sector: +7.0%
Week of 12/9/2024:
Click link for complete Economic Calendar.
United States - Consumer Price Index, Producer Price Index and export & import prices.
Inflation figures - Mexico, Brazil, South Africa, Russia, and India.
China - consumer and producer inflation, trade data, and New Yuan Loans.
Germany - balance of trade and wholesale prices.
United Kingdom - October's GDP growth and industrial production.
Australia - labour report and NAB business confidence.
Japan - Tankan manufacturing index.
Keep reading with a 7-day free trial
Subscribe to PalmaFutures Newsletter to keep reading this post and get 7 days of free access to the full post archives.