


Sunday Post - Recap & Week Ahead 2/16/2025

NOTE: Free subscribers will continue to receive the weekly Sunday Post, but it will not include the final section with the chart, key levels, and detailed analysis for the upcoming week. Upgrade to a paid subscription to unlock the full Sunday Post and gain exclusive access to subscriber-only daily game plans.
ALSO, THERE WILL BE NO POST TOMORROW, February 17, DUE TO A US HOLIDAY.
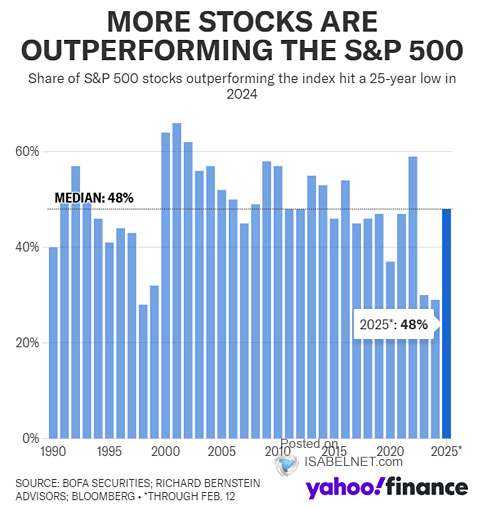
The week reflected a cautious yet resilient market environment, with major US indexes posting modest gains. The S&P 500 climbed approximately 1.5%, trading near record highs, while the Dow Jones rose 0.5%, supported by the stability of blue-chip stocks. The Nasdaq outperformed, advancing 2.6% for the week as technology stocks continued to rally. Notably, market leadership has broadened in 2025. Unlike in 2023 and 2024, when a handful of large tech companies dominated gains, nearly half of S&P 500 stocks are now outperforming the index, signaling a more balanced market. See the graph below:
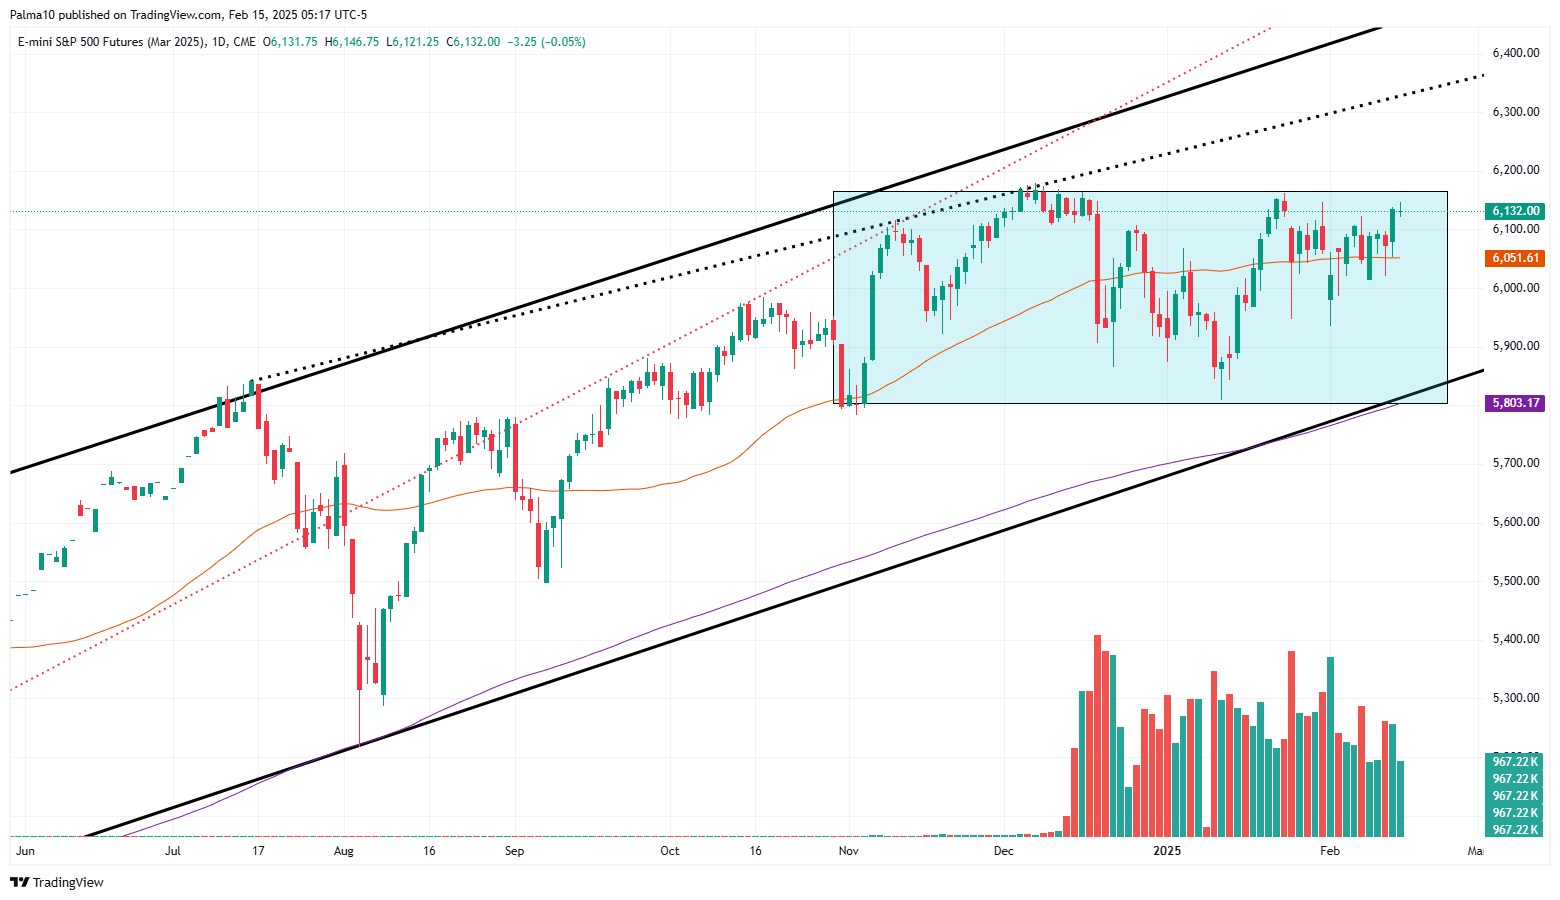
The ES market continued to consolidate, with the daily 50 MA consistently acting as support whenever prices dipped below it. As highlighted in the daily chart below, the market has remained rangebound since early November but continues to trade within an upward channel extending from the October 2023 low (black solid lines). The market is near the upper boundary of this sideways range and there´s a good chance of a breakout.
As usual, I will do a brief recap of this week´s market action, followed by an analysis of the general markets and the various sectors, and conclude with an outlook for the upcoming week.
Recap:
The ES market opened on Sunday with another gap down, similar to previous weeks. However, the Buyers quickly stepped in, driving prices back above the weekly Pivot of 6036 and reclaiming the daily 50 MA/20 MA. After a period of consolidation, the market briefly dropped below these key levels before rebounding to reclaim them once again. On Thursday, the market rallied toward the upper boundary of the Balance range, but the Buyers struggled to generate enough momentum for a breakout the following day. As a result, the market remains near the top of what is now a 21-Day Balance.
General Markets and Sectors:
Check out the updated Charts Page which goes with this section.
The S&P 500 defended the daily 50 MA, resulting in a push back higher and broke the 6090 resistance. It is now trading at the all-time record high. Supports are 6009/daily 50 MA.
The NDX/Nasdaq defended the daily 50 MA/21625 level (now supports) and moved higher to the 22100 resistance, which is at the all-time record high.
The Dow Jones consolidated around the 44359 support. Next resistance is at 45014 (all-time high) and next supports are at the daily 50 MA/43730 level.
Small Caps (IWM) has been consolidating since mid-January around the 227 support and the daily 50 MA.
The FFTY index rallied higher to the June 2022 highs. It remains in the upward channel from the August lows.
The $VIX moved lower to the January lows and remains Bearish.
Crude Oil sold off after being rejected at the $73 resistance, as well as the daily 50 MA. It is now back-testing the downward channel from the March 2022 high. Let´s see if this area holds, if not, next support is at $67.
Gold made a new all-time record high for the third week in a row but looks quite extended. Supports are at the 2865 level and the 2787 level, which aligns with the previous October high.
The US 10-Year yield initially rallied higher and broke above the 4.57% resistance. But this level failed to hold resulting in a selloff toward the 4.40% support. It is now back below the daily 50 MA.
The USDJPY is consolidating between the 155 resistance/daily 50 MA and the 152 support/daily 200 MA.
Bitcoin continues to consolidate between the 106175 resistance (near all-time high) and the 92500 support. It is now trading below the daily 50 MA.
Semis, SOX has been rangebound since August and is now back above the daily 200 MA/50 MA. It remains in an upward channel from the October 2022 low.
Consumer Disc, XLY has now broken below the upward channel support from the August low and the daily 50 MA was back-tested.
The Retail sector, XRT rallied back inside the upward channel from the November 2023 low. Let´s see if this area holds for further upside.
The Tech sector, XLK has been rangebound since November and rallied higher moving toward the upper limit of this range. It remains in the upward channel from the January 2023 low.
Transports, IYT defended the daily 50 MA and rallied higher toward the recent highs. It remains in the upward channel from the October 2022 low.
Financials sector, XLF is trading near the all-time record high. It remains inside the upward channel from the October 2023 low.
The Materials sector, XLB defended the daily 50 MA and rallied higher to the 200 MA, which got rejected. It remains in the upward channel from the October 2022 low.
Industrials, XLI continues to consolidate around the daily 50 MA. It remains in an upward channel from the March 2020 low.
The Health sector, XLV got rejected at the daily 200 MA and sold off.
Consumer Staples, XLP defended the daily 200 MA/50 MA and rallied higher.
Utilities, XLU is consolidating above the daily 50 MA. It remains in the upward channel from the October 2023 low.
The Energy sector, XLE continues to consolidate around the daily 200 MA/50 MA. Note that this market has been rangebound for at least two years (shaded area).
YEAR-TO-DATE RETURN:
DJIA Dow Jones +4.9%
SPX S&P 500 +4.1%
IXIC Nasdaq +3.8%
IYT Dow Jones Transports: +7.4%
XLF U.S. Financial Sector: +7.2%
XLB U.S. Materials Sector: +6.8%
XLV U.S. Health Care Sector: +5.3%
XLE U.S. Energy Sector: +5.1%
XLU U.S. Utilities Sector: +4.5%
XLI U.S. Industrials Sector: +4.4%
XLK U.S. Technology Sector: +3.2%
SOX Semiconductor Index: +2.7%
XLP U.S. Consumer Staples Sector: +2.5%
XLY U.S. Consumer Disc Sector: +1.2%
XRT U.S. Retail Industry: -0.3%
Week of 2/17/2025:
Click link for complete Economic Calendar.
United States - building permits, housing starts, existing home sales, and S&P Global PMI data. Also, release of the FOMC minutes and speeches by several Federal Reserve officials.
Interest rate decisions - Australia, New Zealand and China.
Inflation figures - Canada, United Kingdom, South Africa, and Japan.
Trade Balance reports - the Euro Area, India and Japan.
PMI figures - Australia, Japan, India, France, Germany, Euro Area, and UK.
Germany - ZEW Economic Sentiment Index.
Retail Sales data - UK and Canada.
Keep reading with a 7-day free trial
Subscribe to PalmaFutures Newsletter to keep reading this post and get 7 days of free access to the full post archives.