


Sunday Post - Recap & Week Ahead 1/5/2025

NOTE: Free subscribers will continue to receive the weekly Sunday Post, but it will not include the final section with the chart, key levels, and detailed analysis for the upcoming week. Upgrade to a paid subscription to unlock the full Sunday Post and gain exclusive access to subscriber-only daily game plans.
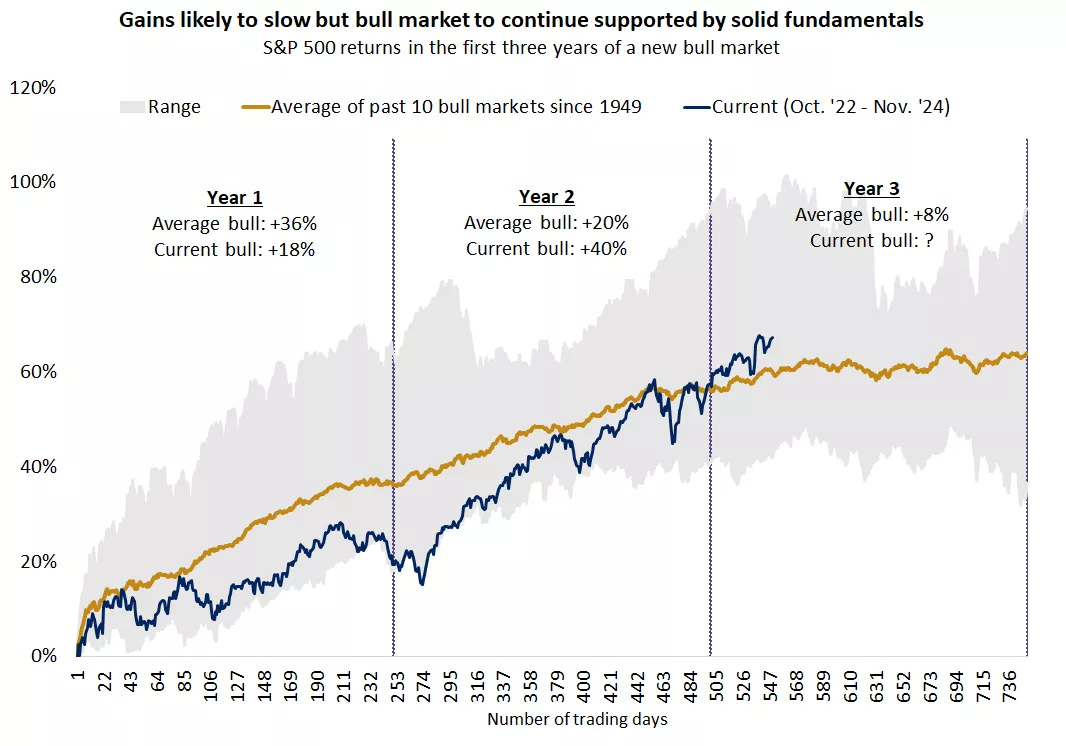
The first trading week of 2025 saw US markets start on a cautious note, as all three major indexes posted modest declines. The S&P 500, Nasdaq and Dow Jones each fell approximately 0.5% for the week, reflecting a pause following a remarkable year for the markets in 2024. The S&P 500 concluded 2024 with an impressive return of over 23%, marking the second consecutive year of gains exceeding 20%. This back-to-back performance - the strongest since 1997/1998 - underscored the resilience of US markets despite global macroeconomic uncertainties. However, the rally’s narrow breadth raised concerns among market participants. According to S&P Dow Jones Indices, just seven technology-oriented stocks contributed over 53% of the S&P 500’s total return for the year. The main drivers that propelled the stock market higher over the past 12 months appear poised to continue in 2025, but history suggests that gains may be more moderate during the third year of a new Bull market. The chart below illustrates the performance of the S&P 500 index in each of the past 10 Bull markets since 1949 as they have approached year three.
Source: FactSet
Performance across sectors varied widely in 2024, further highlighting the concentrated nature of last year’s gains. Communication services and information technology emerged as clear winners for the second consecutive year, delivering total returns of 40.2% and 36.6%, respectively. Conversely, the materials sector struggled, posting a slightly negative return for the year, reflecting weaker demand dynamics and margin pressures.
Attention has now shifted to the historical significance of January’s market performance as a barometer for the full year. Data from S&P Dow Jones Indices reveals that since 1929, the S&P 500 has delivered a positive annual return approximately 71% of the time after gaining ground in January. Conversely, a decline in January has often preceded a negative year for equities. This seasonal pattern is likely to be closely monitored by investors in the coming weeks.
The ES market sold off, breaking below the daily 50 MA once again and then tested the recent lows from over a week ago. For now, this area has been defended and the market bounced back higher, as shown in the daily chart below. However, the Buyers will be encountering overhead resistance at the daily 50 MA and 20 MA (not shown), which will be a critical area next week.

As usual, I will do a brief recap of this week´s market action, followed by an analysis of the general markets and the various sectors, and conclude with an outlook for the upcoming week.
Recap:
As mentioned in the prior Sunday Post, the weekly Pivot/daily 50 MA area was expected to serve as a decisive battleground between Buyers and Sellers. At the open of the overnight session on Sunday, the weekly Pivot area faced rejection, leading to a selloff in the ES market. Selling pressure pushed the market to the bottom of the 4-Day Balance range, which was subsequently broken. Throughout the week, the market attempted to re-enter the Balance range multiple times but failed each time, triggering further selloffs. All downside targets outlined in the prior Sunday Post were not only achieved but also exceeded. On Thursday, the market found support near the 5870 level and rebounded, with the recovery extending into Friday's session. As a result, the market managed to close within the 4-Day Balance range. Currently, the market has transitioned into a 3-Day Balance.
General Markets and Sectors:
Check out the updated Charts Page which goes with this section.
The S&P 500 broke below the daily 50 MA, then consolidated between this area and the 5870 support. The 50 MA must be reclaimed for the upside and next resistance is at 6009.
The NDX/Nasdaq broke below the daily 50 MA and then rebounded near the 20675 support, which led to the reclaim of the 50 MA and the 21171 support. Next resistance is now at 21625.
The Dow Jones broke below the 42700 support and the upward channel support from the October 2023 low, then consolidated right below this area. For the upside, this market must move back inside the channel and next resistances are at 43276/the daily 50 MA.
Small Caps (IWM) continues to consolidate right below the upward channel from the October 2023 low and the 227 level, which are resistances. Next support is at the daily 200 MA.
The FFTY index broke below the daily 50 MA and then briefly below the upward channel support from the August lows. However, this zone was reclaimed with the market closing back above the 50 MA.
The $VIX rallied towards the 20 level but then sold off on Friday. Another push lower will turn this market Bearish.
Crude Oil defended the daily 50 MA and the long-term support line, which led to a rally that broke the downward channel resistance from the March 2022 high and $73 level (now support). Next resistances are at the 200 MA and $77.
Gold continues to consolidate between the 2720 resistance and the 2605 support. Immediate resistance is at 2672/daily 50 MA and next support is at 2525.
The US 10-Year yield consolidated around the 4.57% level. Next resistance is at 4.75% which coincides with the April high.
The USDJPY consolidated at the 157.75 resistance. If broken, next resistance is at 160.
Bitcoin continues to consolidate above the 93500 support and closed above the daily 50 MA. Next resistance is at 101275 and next support is at 87300.
Semis, SOX has been rangebound since August and is currently trading above the daily 200 MA/50 MA. It remains in an upward channel from the October 2022 low. Breaking out of the triangular pattern could lead to higher prices.
Consumer Disc, XLY sold off to the daily 50 MA and then bounced back higher. It remains in a steep upward channel from the August low.
The Retail sector, XRT consolidated below the daily 50 MA and the 79-support level was defended. It remains in an upward channel from the November 2023 low.
The Tech sector, XLK has been rangebound since November and closed above the daily 50 MA, which has been holding as support. It remains in the upward channel from the January 2023 low.
Transports, IYT consolidated above the daily 200 MA and remains in the upward channel from the October 2022 low.
Financials sector, XLF broke below the daily 50 MA and consolidated at the upward channel support from the October 2023 low.
The Materials sector, XLB consolidated at the upward channel support from the October 2022 low.
Industrials, XLI consolidated around the August highs, which is acting as support for now. It remains in an upward channel from the March 2020 low.
The Health sector, XLV is consolidating in a strong support area and being defended for now. It is in a downtrend for the short term.
Consumer Staples, XLP sold off and broke below the daily 200 MA, then consolidated below this level.
Utilities, XLU moved higher after consolidating above the daily 200 MA, which is also a strong support area.
The Energy sector, XLE rallied higher after defending the September lows, which is near a strong support zone. Note that this market has been rangebound for at least two years (shaded area).
YEAR-TO-DATE RETURN:
IXIC Nasdaq +1.6%
SPX S&P 500 +1.0%
DJIA Dow Jones +0.5%
SOX Semiconductor Index: +2.8%
XLE U.S. Energy Sector: +2.1%
XLU U.S. Utilities Sector: +1.8%
IYT Dow Jones Transports: +1.5%
XLK U.S. Technology Sector: +1.4%
XLV U.S. Health Care Sector: +1.0%
XLI U.S. Industrials Sector: +0.7%
XLY U.S. Consumer Disc Sector: +0.7%
XLF U.S. Financial Sector: +0.5%
XRT U.S. Retail Industry: +0.1%
XLP U.S. Consumer Staples Sector: -0.4%
XLB U.S. Materials Sector: -1.1%
Week of 1/6/2025:
Click link for complete Economic Calendar.
Keep reading with a 7-day free trial
Subscribe to PalmaFutures Newsletter to keep reading this post and get 7 days of free access to the full post archives.