


Sunday Post - Recap & Week Ahead 12/22/2024

NOTE: Free subscribers will continue to receive the weekly Sunday Post, but it will not include the final section with the chart, key levels, and detailed analysis for the upcoming week. Upgrade to a paid subscription to unlock the full Sunday Post and gain exclusive access to subscriber-only daily game plans.
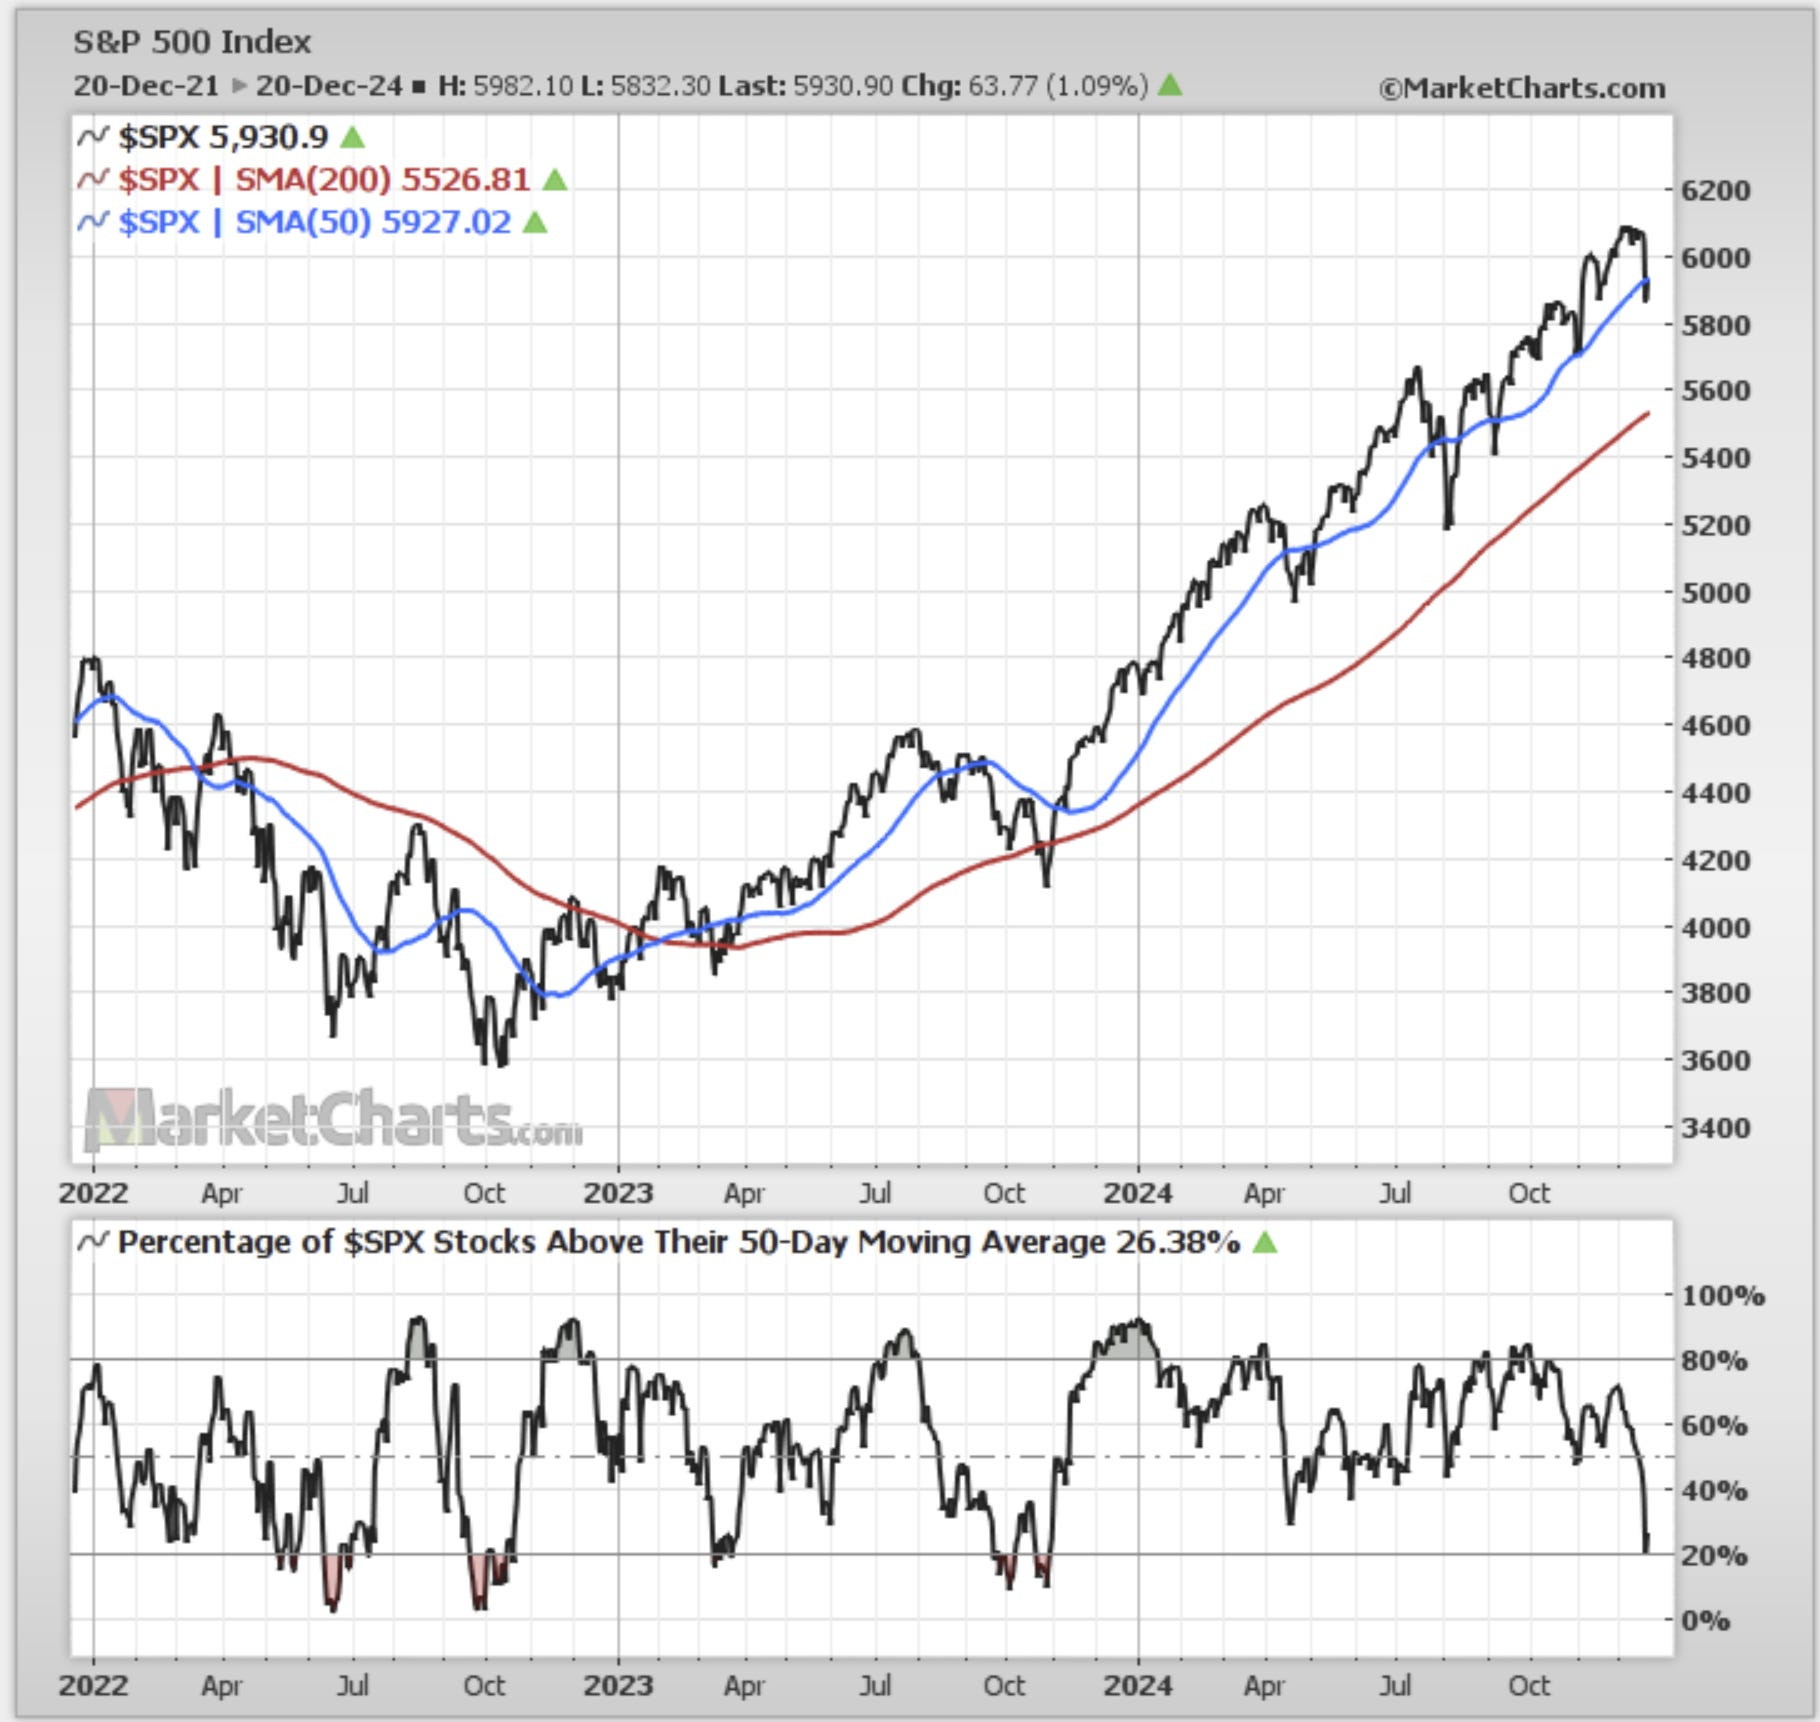
The US stock market was marked by heightened volatility this week, with all major indexes ultimately posting losses of approximately 2%. Midweek turbulence, driven by concerns over Federal Reserve policy, culminated in a sharp selloff on Wednesday. However, a partial recovery rally on Friday provided some relief to investors. The $VIX spiked to its second highest level this year after the FOMC meeting (around 28) but settled back below 20 by Friday´s close. The S&P 500 has dropped approximately 4% from its peak, briefly falling below the daily 50 MA before rebounding. Market breadth has shifted toward oversold levels, which could signal the potential for a year-end rally. See chart below:
h/t:
The ES market broke below the 11-Day Balance and subsequently breached the triangle pattern, highlighting the market's coiling behavior as it approached new highs. It also broke below the daily 50 MA as shown in the daily chart below. The market rebounded somewhat, recovering some lost ground, but failed to close above the 50 MA. This level now serves as a critical indicator to monitor in the coming sessions, as it will determine whether the market can reclaim this level or face further rejection.

As usual, I will do a brief recap of this week´s market action, followed by an analysis of the general markets and the various sectors, and conclude with an outlook for the upcoming week.
Recap:
The ES market started the week with an upward move toward the top of the 11-Day Balance but sold off on Tuesday, testing the bottom of the range. After a brief rebound, the market decisively broke below the Balance on Wednesday, triggering a significant selloff that surpassed all downside targets for the week. Following another low on Friday, the market staged an impressive rally, briefly reclaiming the daily 50 MA. However, some selling pressure emerged in the afternoon, causing the market to settle below this key moving average.
General Markets and Sectors:
Check out the updated Charts Page which goes with this section.
The S&P 500 sold off breaking below the 6009-support level (now resistance) and briefly dipping below the 5870 support before reclaiming it and closing right at the daily 50 MA.
The NDX/Nasdaq sold off breaking below the 21625 support (now resistance) and briefly dipping below the 21171 support, moving lower towards the daily 50 MA before reclaiming it.
The Dow Jones sold off breaking below the daily 50 MA and moving right to the upward channel support from the October 2023 low, near the 42700 support, which were defended. Next resistances are 43276 and 43730.
Small Caps (IWM) sold off breaking below the daily 50 MA and the upward channel from the October 2023 low. It is now approaching the daily 200 MA and next resistance is at 227 which coincides with the back-test of the upward channel.
The FFTY index sold off to the upward channel from the August lows and bounced back higher closing above the daily 50 MA. Need to see follow through for the upside.
The $VIX jumped higher to 28 but then sold off moving below the important 20 level. It remains Bullish for now but can turn Bearish quickly if the selloff persists.
Crude Oil consolidated below the daily 50 MA and defended the long-term support line. As long as this holds, next resistance is at $73, which aligns with the downward channel resistance from the March 2022 high. Support is at $67 which has been holding strongly since September.
Gold continues to consolidate between the 2720 resistance and the 2605 support.
The US 10-Year yield broke above the 4.40% resistance (now support) and moved higher right to the 4.57% resistance. Next resistance is at 4.75% which coincides with the April high.
The USDJPY rallied higher breaking above the 155 resistance (now support) and moving to the 157.75 resistance. Next resistance is at 160. Note the daily 50 MA has crossed above the 200 MA.
Bitcoin rallied higher to a new all-time record high, also reaching a long-term resistance line before selling off to the daily 50 MA. This zone, including the 94375 support were defended. Next resistance is at 101275 and then the all-time high.
Semis, SOX has been rangebound since August and is currently trading below the daily 200 MA/50 MA. It remains in an upward channel from the October 2022 low.
Consumer Disc, XLY made another all-time record high before selling off. It remains in a steep upward channel from the August low.
The Retail sector, XRT sold off to the daily 50 MA which was defended. It remains in an upward channel from the November 2023 low.
The Tech sector, XLK sold off and broke briefly below the daily 50 MA, which was then reclaimed. It remains in the upward channel from the January 2023 low.
Transports, IYT sold off to the daily 200 MA which looks like could be defended. It remains in the upward channel from the October 2022 low.
Financials sector, XLF sold off breaking below the daily 50 MA and moving to the upward channel support from the October 2023 low, which got defended.
The Materials sector, XLB sold off further down and is now approaching the upward channel support from the October 2022 low.
Industrials, XLI sold off further down and seems to have found support at the August high. It remains in an upward channel from the March 2020 low.
The Health sector, XLV continued to move lower and is in a strong support area, which could get defended. Note the daily 50 MA has crossed below the 200 MA.
Consumer Staples, XLP sold off breaking below the daily 50 MA and moving towards the 200 MA. This zone is also support and could be defended.
Utilities, XLU sold off towards the daily 200 MA, which is also a strong support area.
The Energy sector, XLE sold off to the September lows and is approaching a strong support zone. Note the daily 50 MA about to cross below the 200 MA.
YEAR-TO-DATE RETURN:
IXIC Nasdaq +31.3%
SPX S&P 500 +26.0%
DJIA Dow Jones +15.8%
XLF U.S. Financial Sector: +30.5%
XLY U.S. Consumer Disc Sector: +28.8%
XLU U.S. Utilities Sector: +23.5%
XLK U.S. Technology Sector: +23.2%
SOX Semiconductor Index: +21.1%
XLI U.S. Industrials Sector: +18.5%
XLP U.S. Consumer Staples Sector: +13.2%
XRT U.S. Retail Industry: +13.2%
IYT Dow Jones Transports: +4.1%
XLE U.S. Energy Sector: +2.8%
XLV U.S. Health Care Sector: +2.3%
XLB U.S. Materials Sector: +1.3%
Week of 12/23/2024:
The last days of 2024 will be light in terms of economic reports.
Click link for complete Economic Calendar.
Keep reading with a 7-day free trial
Subscribe to PalmaFutures Newsletter to keep reading this post and get 7 days of free access to the full post archives.