
Sunday Post - Recap & Week Ahead 9/28/2025
Stock Market Analysis & Insights, Charts and Levels

PLEASE SEE INTRO POST AND READ DISCLAIMER & INTELLECTUAL PROPERTY SECTIONS
NOTE: Free subscribers will continue to receive the weekly Sunday Post, but it will not include the final section with the chart, key levels, and detailed analysis for the upcoming week. Upgrade to a paid subscription to unlock the full Sunday Post and gain exclusive access to subscriber-only daily game plans.
The US stock market finished the week lower, with the three major US stock indexes slipping modestly and small caps underperforming. Each of the major US stock indexes set record highs on Monday, but the Dow Jones, S&P 500 and Nasdaq all ended the week slightly down, while the Russell 2000 also retreated. Breadth weakened for the week as decliners outpaced advancers on both the NYSE and Nasdaq, volatility stayed subdued, and Treasury yields were little changed after the Fed’s recent policy shift.
S&P 500 fell 0.3% to close at 6,644
Nasdaq declined 0.7% to end at 22,484
Dow Jones slipped 0.1% to finish at 46,247
Russell 2000 dropped 0.6%, closing at 2,434
Sector performance: the week’s biggest winners were Energy (XLE) +2.9%, Utilities (XLU) +2.1%, and Semiconductors (SOX) +1.2%, compared to Materials (XLB) –2.2%, Consumer Staples (XLP) –1.8%, Health (XLV) –1.3%, and Communication Services (XLC) –1.0%. Market breadth deteriorated: decliners outnumbered advancers on both the NYSE and Nasdaq for the week, highlighting weakening participation. Investor sentiment: AAII bullish sentiment held at 41.7% and the CNN Fear & Greed index eased to 53 (neutral territory). The VIX edged slightly lower, down 1.0% for the week, closing around 15.3.
Bond yields were steady with the 10-Year Treasury around 4.20% and the 30-Year near 4.77% as markets digested the Fed’s policy stance. Gold climbed for the sixth consecutive week and set another record high, closing around $3,758 per ounce. WTI crude oil moved higher, up 4.5%, ending the week near $65.00/bbl. Bitcoin finished the week lower, down over 5.0% to roughly $109,690. US-listed spot Bitcoin ETFs saw mixed flows, with net outflows across the group despite ongoing inflows into select funds (several days of inflows but data providers showed a net weekly outflow for the ETF group in the Sept 22–26 window, with some funds like BlackRock’s IBIT still taking inflows).
Overall, it was a consolidative week for US risk assets — marked by modest pullbacks in large-cap indexes, relative sector leadership from defensives (Energy and Utilities), lagging performance from small caps and cyclicals, breadth deterioration, subdued volatility, stable Treasury yields, and weakness in Bitcoin after several strong inflow weeks.
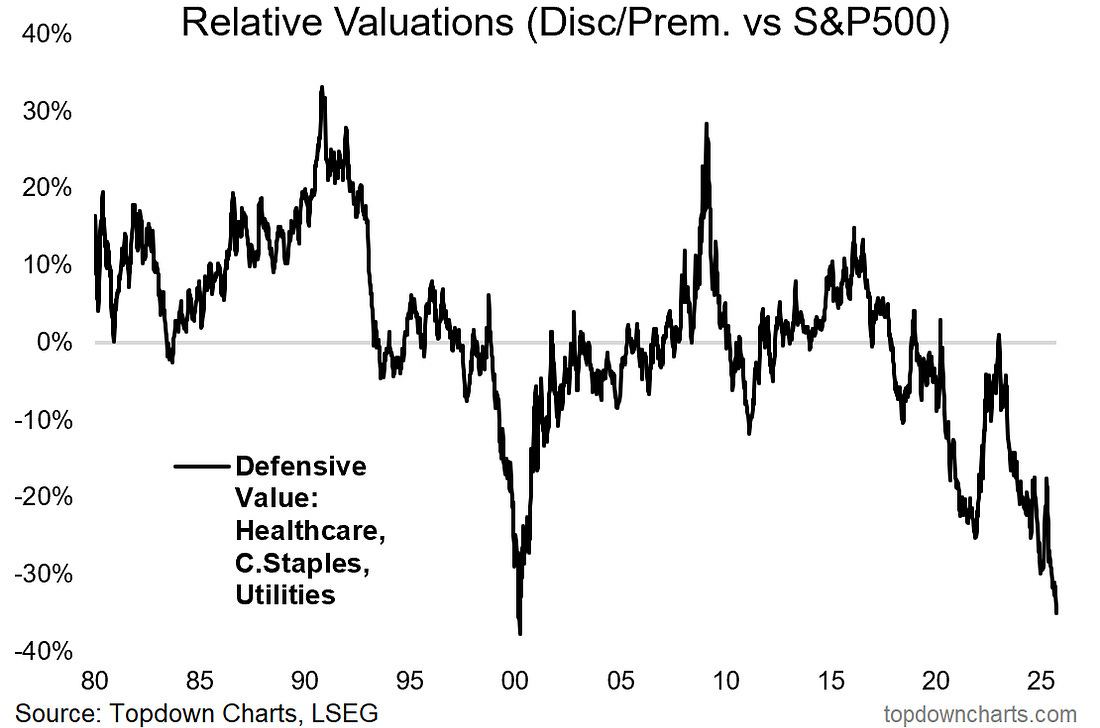
One of the most striking long-term signals right now is the relative valuation of defensive sectors — healthcare, utilities, and consumer staples — versus the S&P 500. The first chart shows that defensives are trading at one of their deepest discounts in history, approaching levels last seen during the late-1990s dot-com bubble. At that time, investors shunned “boring” defensives in favor of growth and tech, only for the pendulum to swing back sharply in the years that followed. Today, the setup looks eerily similar, with valuations stretched in favor of growth and defensives priced as if they barely matter.
h/t:
The second chart overlays the relative performance of defensives against the S&P 500. The message is clear: the extremes of this line tend to coincide with important turning points in the broader market cycle. Defensives outperform massively when investors rush to safety during major bear markets but underperform at market peaks when risk appetite is at its highest. The fact that defensives are now so deeply out of favor is not just an opportunity for value-oriented investors, it also serves as a warning sign. Historically, similar readings have lined up with frothy sentiment, heavy crowding in the market’s hottest areas, and vulnerability to a broader correction.
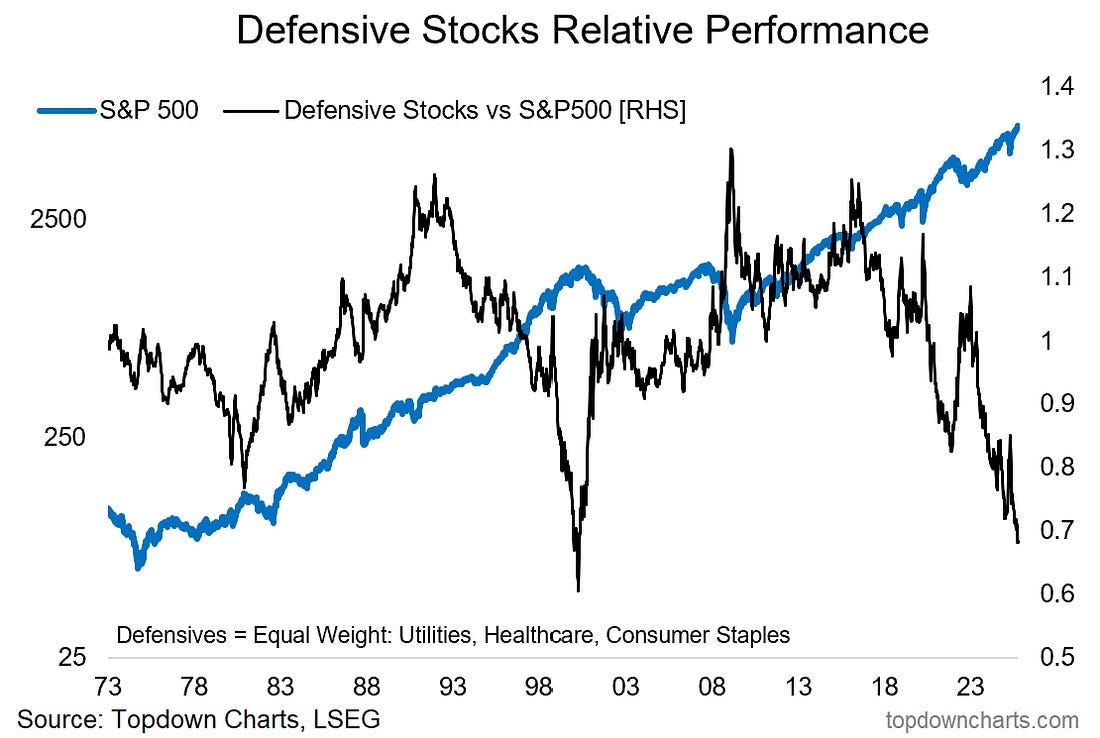
Bottom line: Defensives may look cheap — and indeed they are — but the real story here is what their relative discount says about the overall market environment. Just as in 1999–2000, extreme underperformance in defensives reflects excessive risk-taking elsewhere, and that tends to be a late-cycle signal.
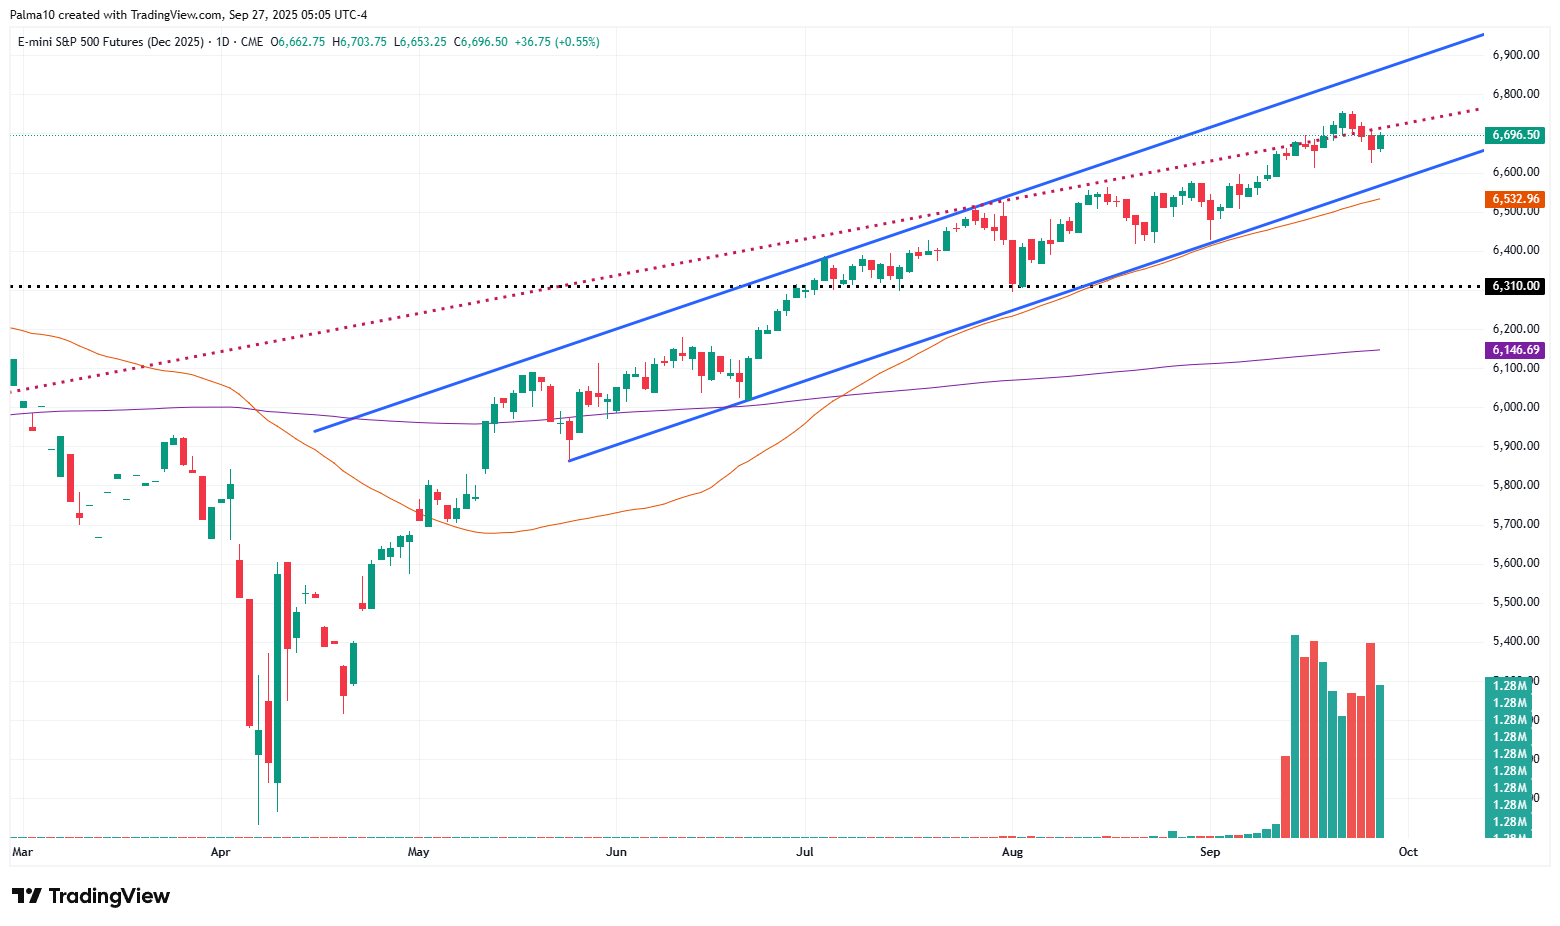
Last week, the ES market broke above the overhead resistance defined by the prior rising channel that originated from the October 2023 low (red dotted line), confirming a decisive breakout to new all-time highs. However, after setting another record high on Monday, the market reversed lower and slipped back beneath this resistance, turning the breakout into a failure. See the daily chart below. While the market continues to trade within a well-defined upward channel (blue lines) that began at the May 23rd low, some doubt has emerged around the durability of the uptrend, particularly as seasonality tends to soften into October.
As usual, I will do a brief recap of this week´s market action, followed by an analysis of the general markets and the various sectors, and conclude with an outlook for the upcoming week.
Recap:
Early in the week, the key support area highlighted in the prior Sunday Post was defended without being breached, and as a result, the ES market rallied to a new all-time high. However, the Buyers failed to gain further traction as the rally stalled exactly at the second upside target of the week. This triggered a sharp selloff that broke below the key support area—an outcome required for the Bearish case outlined last Sunday. I also cautioned about the persistent Bearish divergences across multiple timeframes in that same post. By Thursday, the market had reached the third downside target of the week, a level that coincided with the daily 20 MA, where support emerged and sparked a Friday rebound back into the key support area, now acting as resistance. With this new market-generated information, the ES market has transitioned into an 11-Day Balance.
General Markets and Sectors:
Check out the updated Charts Page which goes with this section.
The S&P 500 made another all-time high before selling off to the 6551 support, which was strongly defended. It has approached the upward channel resistance originating from the March 2020 low.
The NDX/Nasdaq made another all-time high and then pulled back. Resistance is at 24761 and support is at 23960. It remains in the upward channel from the December 2022/January 2023 lows.
The Dow Jones made another all-time high before selling off and re-testing a long-term resistance line (now acting as support). Resistance is at 46714 and support is at 45770.
Small Caps (IWM) made another all-time high but then sold off and broke back below the prior 243 resistance level.
The FFTY index initially moved higher toward the March 2022 high and then sold off, back-testing the upward channel from the October 2023 low.
The $VIX initially moved higher but then sold off sharply on Friday. As a result, it remains technically weaker which reflects a generally Bullish environment for equities.
Crude Oil moved higher and reclaimed the daily 50 MA which was acting as resistance. However, it got rejected at the 200 MA or the $67 resistance level.
Gold made a new all-time high yet again and hit the upward channel resistance from the February 2024 low. For now, this area is being rejected, so there’s a good chance of some pullback.
The US 10-Year rebounded from the 4.0% support and moved higher to the 4.21% resistance. It remains in the downward channel from the October 2023 high.
The USDJPY has been in consolidation between the 145 support and the 150 resistance. It has now moved back above the daily 50 MA/200 MA and remains in an upward channel from the January 2021 low.
Bitcoin got rejected at the 116025-resistance level (just above the daily 50 MA) and sold off to the 110300 support. If there´s more downside, it could move to the 106175-support level/200 MA. It remains in the upward channel from the October 2023 low.
Semis, SOX made another all-time high and then pulled back. It remains in the upward channel from the October 2022 low.
Consumer Disc, XLY sold off some from the all-time high and remains in the upward channel from the December 2022 low.
The Retail sector, XRT got rejected at the prior rising channel (black dotted lines) from the November 2023 low and sold off, back-testing the upward channel from the September 2022 low.
The Tech sector, XLK made another all-time high and then pulled back. It has been trading inside the prior upward channel from the October 2022 low (blue dotted lines).
Transports, IYT continues to consolidate at the daily 50 MA, which is holding for now. It remains in the upward channel from the October 2023 low.
Financials sector, XLF continues to consolidate at the all-time highs. It remains in the upward channel from the October 2023 low.
The Materials sector, XLB sold off and broke below the daily 50 MA, moving lower to the 200 MA which held as support. It remains within a long-term upward channel.
Industrials, XLI has been consolidating near the all-time highs and around the daily 50 MA. It remains in the upward channel from the March 2020 lows.
The Health sector, XLV has been in a wide-ranged consolidation since April and after hitting the downward channel resistance from the September 2024 high (also daily 200 MA), it sold off back down to the 50 MA.
Consumer Staples, XLP has been in a wide-ranged consolidation since May 2024. Recently, it has been selling off moving lower towards both the lower boundary of this range and the upward channel support from the March 2020 low.
Utilities, XLU broke back above the long-term resistance trendline and moved toward the all-time high. It remains in the upward channel from the October 2023 low.
The Energy sector, XLE bounced off the daily 200 MA/50 MA and rallied toward the March highs. It has been rangebound for over two years (shaded area).
YEAR-TO-DATE RETURN:
IXIC Nasdaq +17.0%
SPX S&P 500 +14.1%
DJIA Dow Jones +10.1%
SOX Semiconductor Index: +25.5%
XLK U.S. Technology Sector: +20.5%
XLU U.S. Utilities Sector: +17.1%
XLI U.S. Industrials Sector: +17.0%
XLF U.S. Financial Sector: +12.6%
XLE U.S. Energy Sector: +10.1%
XRT U.S. Retail Industry: +9.5%
XLY U.S. Consumer Disc Sector: +7.5%
XLB U.S. Materials Sector: +7.1%
IYT Dow Jones Transports: +7.0%
XLP U.S. Consumer Staples Sector: +1.1%
XLV U.S. Health Care Sector: -0.2%
Week of 9/29/2025:
Click link for complete Economic Calendar.
United States - US employment report featuring fresh data for payrolls, unemployment, and wage growth. Also, the ADP employment report, results from the JOLTS, and Challenger job cuts.
Eurozone - inflation data.
CPI publications - Turkey and Switzerland.
PMI releases - China, Italy, Canada, Brazil, Mexico, South Korea, and ASEAN states.
Rate decisions - Australia and India.