


Sunday Post - Recap & Week Ahead 1/19/2025

NOTE: Free subscribers will continue to receive the weekly Sunday Post, but it will not include the final section with the chart, key levels, and detailed analysis for the upcoming week. Upgrade to a paid subscription to unlock the full Sunday Post and gain exclusive access to subscriber-only daily game plans.
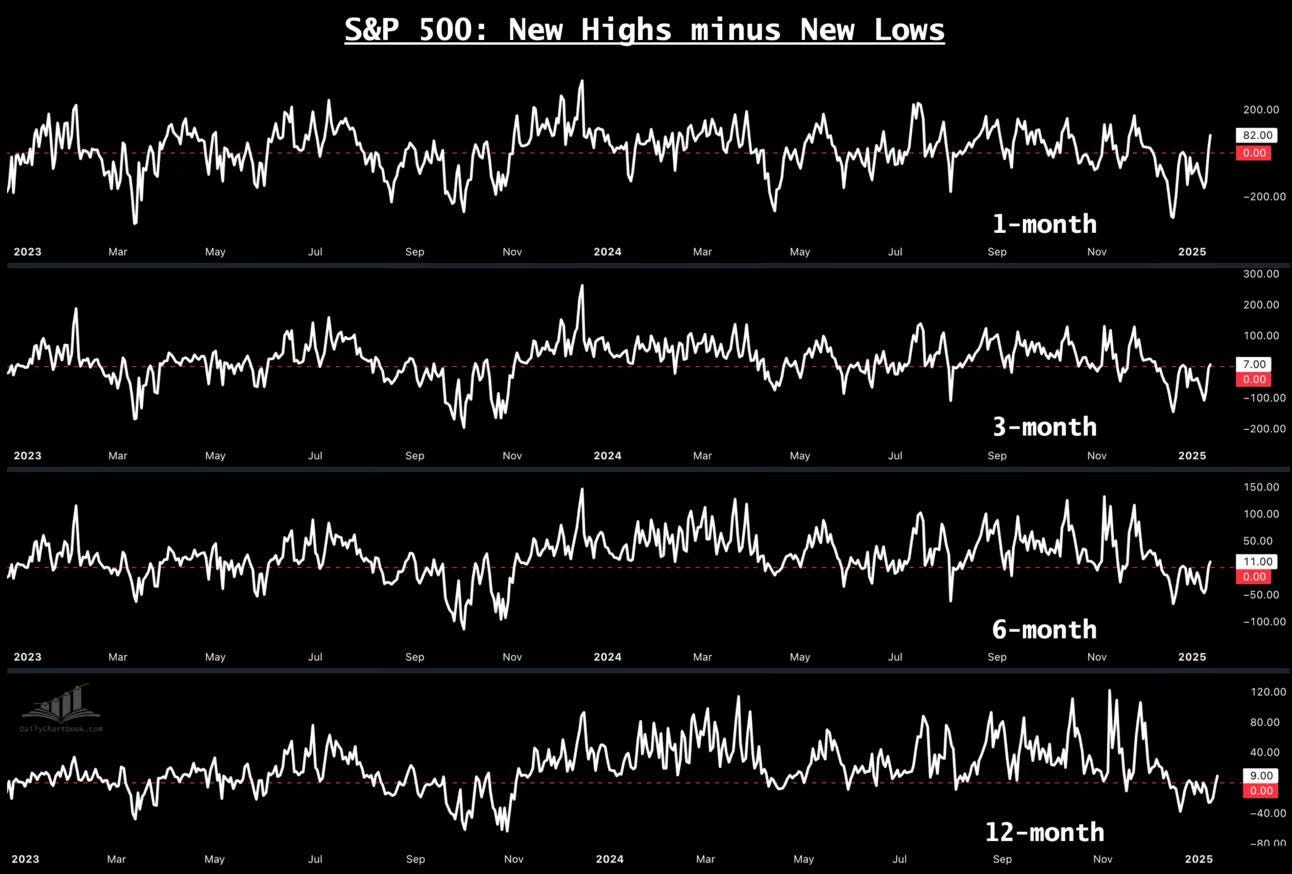
After a sluggish start, the US equity markets found their footing midweek and surged to close with strong gains. All major indexes finished the week up by 2% to 4%, marking a significant rebound and just the second positive week for the S&P 500 out of the past six. By Friday's close, the S&P 500 stood less than 2% below its all-time high of December 6, reflecting renewed optimism among investors. Moreover, New Highs now exceed New Lows across several timeframes as shown in the charts below.
h/t:
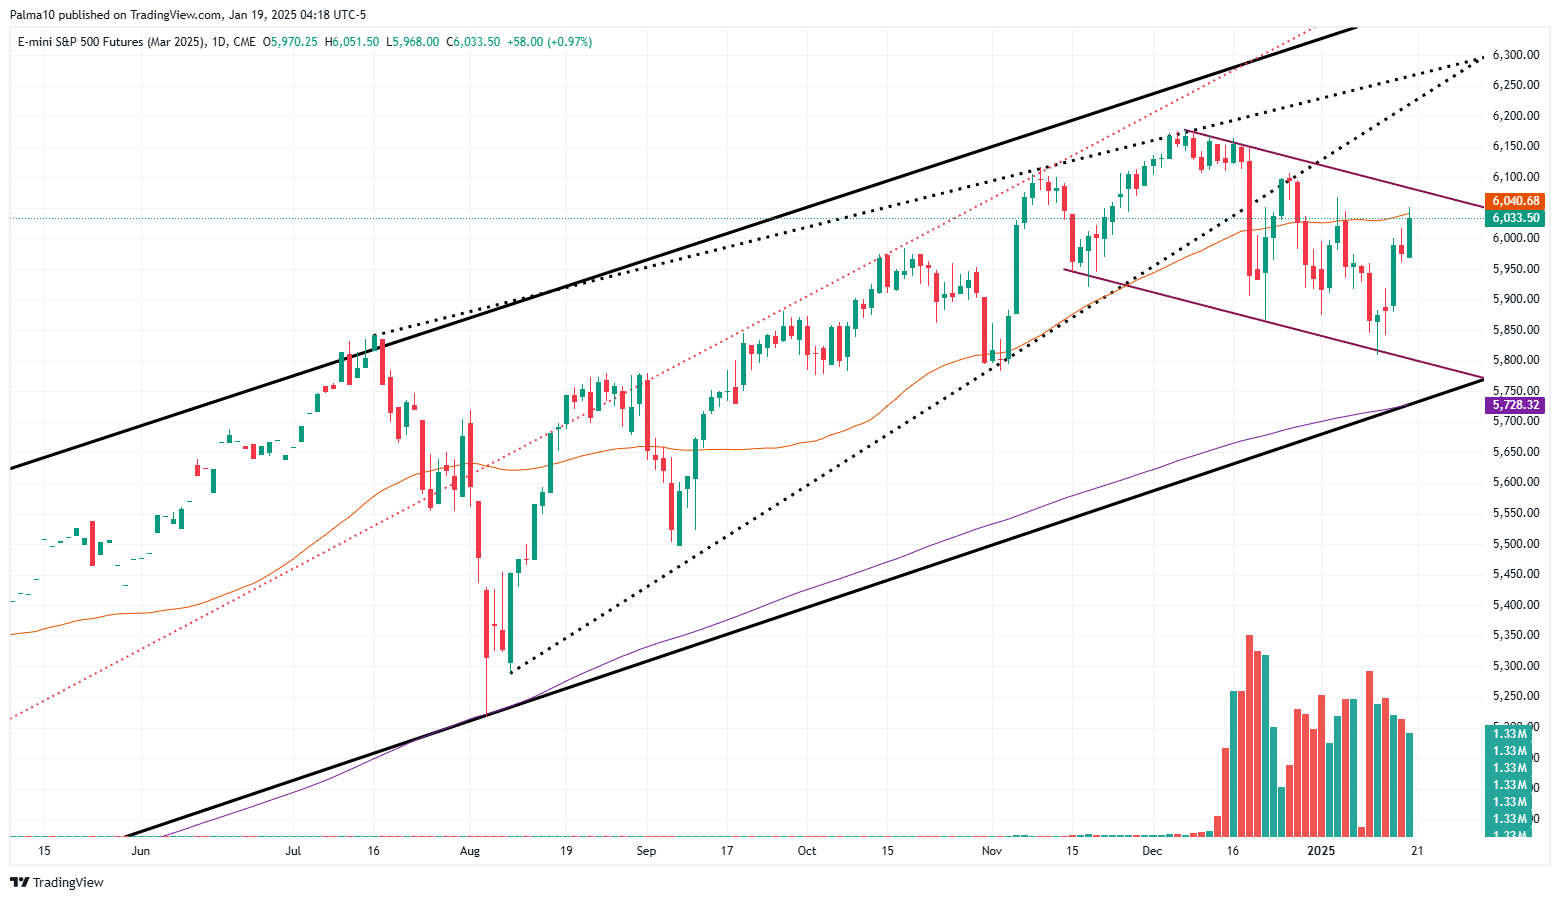
With respect to the ES market, prices found support at the lower boundary of the small downward channel and subsequently rebounded toward the daily 50 MA. However, the market failed to close above the 50 MA, as observed in the daily chart below, instead closing slightly below it. The market is now approaching the channel resistance, which will act as a key inflection point. It remains to be seen whether this resistance will be broken, paving the way for higher prices, or if it will serve as a rejection point, potentially leading to a move lower.
As usual, I will do a brief recap of this week´s market action, followed by an analysis of the general markets and the various sectors, and conclude with an outlook for the upcoming week.
Recap:
Early in the week, the ES market sold off to the lower boundary of the downward channel, as shown in the daily chart above. This bounce occurred at a level that aligned with the downside target outlined in the previous Sunday Post. The significant rally didn’t materialize until Wednesday, when the market moved back into the prior 5-Day Balance range and achieved the second-to-last upside target for the week. On Thursday, the market paused and retraced to the daily 20 MA, where the Buyers stepped in to defend this level. The rally resumed on Friday, with the daily 50 MA reclaimed intraday. However, some afternoon selling pressure led to a close slightly below this moving average. This week was undoubtedly a significant victory for the Bulls, and the key question now is whether the upward momentum will continue.
General Markets and Sectors:
Check out the updated Charts Page which goes with this section.
The S&P 500 defended the 5762-support level, which aligns with the small downward channel support and then rallied higher to the 6009-resistance level, which aligns with the downward channel resistance.
The NDX/Nasdaq defended the 20675-support level (after briefly breaking below it), which aligns with the small downward channel support and then rallied higher to the downward channel resistance area.
The Dow Jones defended the 41915-support level and then rallied higher, breaking back inside the upward channel from the October 2023. It moved towards the 43730 resistance and failed to close above the daily 50 MA.
Small Caps (IWM) bounced off the daily 200 MA and moved higher to the 227-resistance level. It remains below both the daily 50 MA and the upward channel from the October 2023 low.
The FFTY index rallied higher and broke back inside the upward channel from the August lows. After reclaiming the daily 50 MA briefly, it closed right at this MA.
The $VIX sold off after initially breaking above the 20 level for a brief time. It is not quite yet Bearish but getting close.
Crude Oil broke above the $77 resistance level (now support) but the gains were erased as the market sold off back to the $77 level. If there´s traction, next resistance is at $85.
Gold continues to consolidate between the 2720 resistance and the 2605 support. The 2672 immediate support was defended and the market moved higher right to the 2720 level.
The US 10-Year yield sold off from the 4.75% resistance and moved lower right to the 4.57% support.
The USDJPY sold off from the 157.75 resistance and moved lower to the 155 support/daily 50 MA, which got defended.
Bitcoin briefly broke below the 92500 support and then rallied to the 101275 resistance, which was also broken. The market continued to move higher to the 106175 resistance, which got rejected.
Semis, SOX has been rangebound since August and remains in an upward channel from the October 2022 low. It did break out of the triangular pattern one more time.
Consumer Disc, XLY bounced off the upward channel support from the August low and the daily 50 MA.
The Retail sector, XRT consolidated at the upward channel support from the November 2023 low. The 79 level must be reclaimed for the upside.
The Tech sector, XLK has been rangebound since November and rallied higher to the daily 50 MA. It remains in the upward channel from the January 2023 low.
Transports, IYT moved higher to the daily 50 MA and remains in the upward channel from the October 2022 low.
Financials sector, XLF rallied higher and moved back inside the upward channel from the October 2023 low. It also reclaimed the daily 50 MA.
The Materials sector, XLB bounced off the upward channel support from the October 2022 low and moved higher towards the daily 50 MA.
Industrials, XLI bounced off the support area at the August highs and moved higher to the daily 50 MA. It remains in an upward channel from the March 2020 low.
The Health sector, XLV continues to consolidate in a strong support area. It is in a downtrend for the short term.
Consumer Staples, XLP bounced off the July lows which acted as support.
Utilities, XLU bounced off the daily 200 MA and moved higher closing above the daily 50 MA.
The Energy sector, XLE moved higher and reclaimed the daily 50 MA/200 MA. It has now moved back above the uptrend line from the October 2020 low. Note that this market has been rangebound for at least two years (shaded area).
YEAR-TO-DATE RETURN:
DJIA Dow Jones +2.3%
SPX S&P 500 +2.0%
IXIC Nasdaq +1.7%
XLE U.S. Energy Sector: +9.7%
SOX Semiconductor Index: +5.7%
XLB U.S. Materials Sector: +5.0%
IYT Dow Jones Transports: +4.6%
XLI U.S. Industrials Sector: +4.5%
XLU U.S. Utilities Sector: +4.2%
XLF U.S. Financial Sector: +3.9%
XLY U.S. Consumer Disc Sector: +2.2%
XLV U.S. Health Care Sector: +1.9%
XLK U.S. Technology Sector: +0.7%
XRT U.S. Retail Industry: -1.5%
XLP U.S. Consumer Staples Sector: -1.7%
Week of 1/20/2025:
Click link for complete Economic Calendar.
United States - S&P Global PMIs and existing home sales. Also, a busy earnings season with reports from Netflix, Charles Schwab, P&G, J&J, Abbott, Progressive, Intuitive Surgical, General Electric, Texas Instruments, Union Pacific, American Express, Verizon.
Bank of Japan - expected to raise rates by 25 bps.
Flash PMIs - private sector activity in the Euro Area, Germany, UK, India, and Japan.
Germany - ZEW sentiment.
United Kingdom - jobs and wage data.
GDP figures - South Korea and Taiwan.
Rate decisions - Norway, Turkey, and Malaysia.
Keep reading with a 7-day free trial
Subscribe to PalmaFutures Newsletter to keep reading this post and get 7 days of free access to the full post archives.