


Sunday Post - Recap & Week Ahead 12/15/2024

NOTE: Free subscribers will continue to receive the weekly Sunday Post, but it will not include the final section with the chart, key levels, and detailed analysis for the upcoming week. Upgrade to a paid subscription to unlock the full Sunday Post and gain exclusive access to subscriber-only daily game plans.
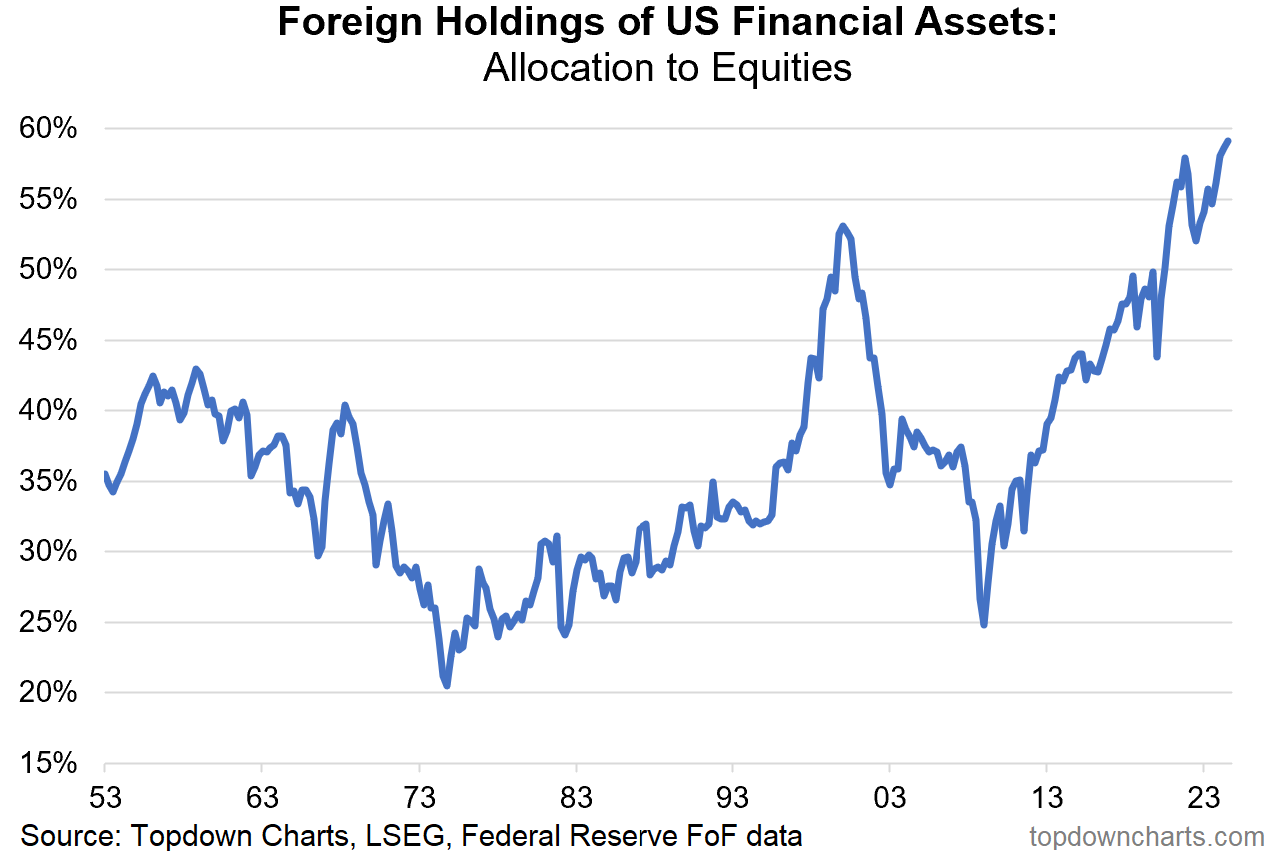
US equities ended the week mixed with divergent performances across the major indexes. The Nasdaq posted modest gains, while the S&P 500 and Dow Jones recorded declines of 0.6% and 1.8%, respectively. Investors remain highly optimistic with a Bullish outlook on the US stock market. This optimism is reflected in record inflows into US equity ETFs during November. Additionally, foreign investors are increasingly rotating into US equities. Foreign holdings of US financial assets have now surpassed the peak levels seen during the dotcom bubble - see chart below.
h/t:
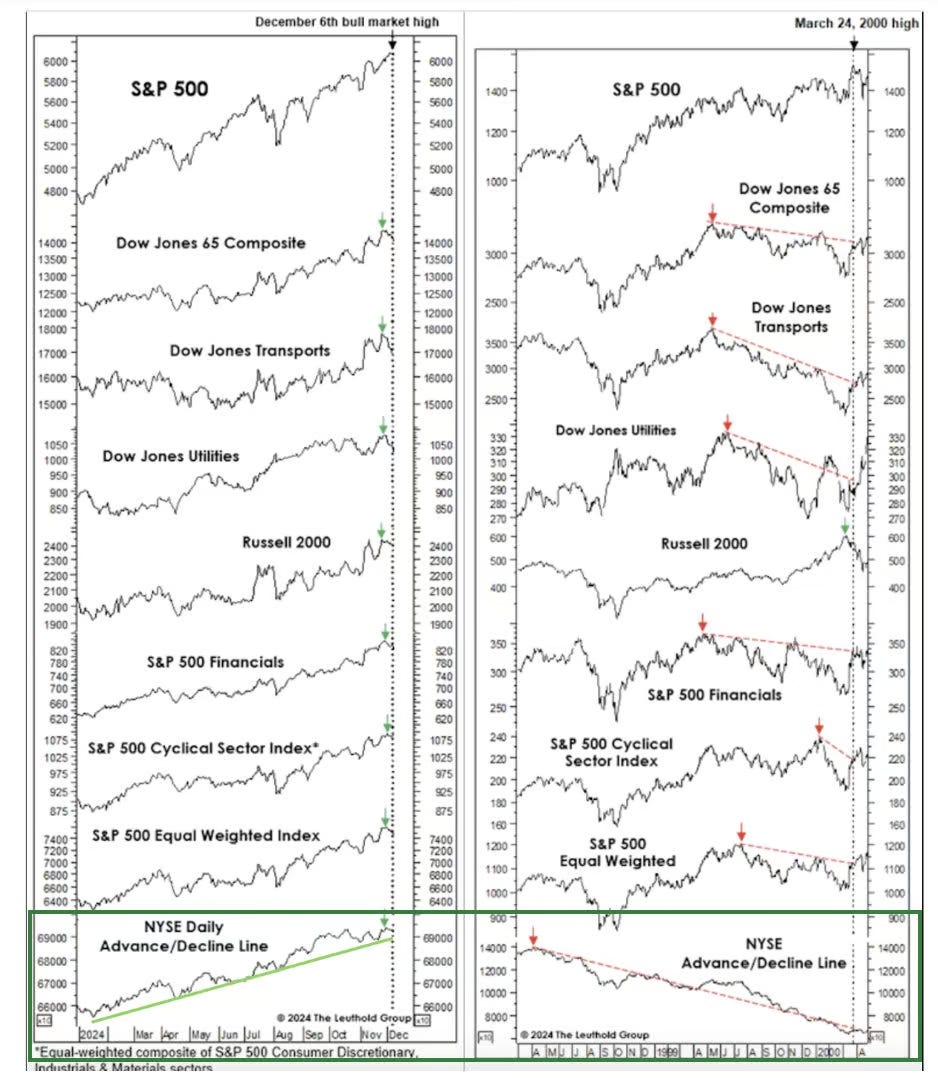
Here is an intriguing series of charts comparing the current Bull market to the 2000 dotcom bubble. Notice the striking divergences evident during the dotcom era that are not present in today’s Bull market - at least for now.
h/t:
With the transition to the March contract (ESH25), I have made some adjustments to the daily ES chart, slightly expanding the upward channel originating from the October 2023 low (black solid lines). The updated chart now highlights a triangle pattern (black dotted lines), suggesting that the market is coiling as it continues to make new all-time highs. At present, the market remains in Balance, a state that will soon be resolved in one direction or the other.

As usual, I will do a brief recap of this week´s market action, followed by an analysis of the general markets and the various sectors, and conclude with an outlook for the upcoming week.
Recap:
The ES market started the week with a selloff, reaching the bottom of the Balance, which was successfully defended. This was followed by a rebound toward the top of the Balance on Wednesday. However, the market reversed course, selling off again, and by Friday, the bottom of the Balance was retested. While the Sellers managed to break below the bottom, it turned into a failed breakdown. The market subsequently staged a modest recovery but ended the week near the bottom of the 9-Day Balance.
General Markets and Sectors:
Check out the updated Charts Page which goes with this section.
The S&P 500 consolidated near the all-time record high and 6009 is now support.
The NDX/Nasdaq made another all-time high and remains above the upward channel from the January 2023 low. Support is now at 21171.
The Dow Jones sold off and broke below the 44359 support (now resistance). It is now approaching the 43730 support and the rising daily 50 MA.
Small Caps (IWM) sold off and broke below the 234 support (now resistance). It is also approaching the rising daily 50 MA.
The FFTY index sold off and looks like the August 2022 highs are holding for now.
The $VIX moved slightly higher and remains Bearish for now.
Crude Oil defended the $67 support one more time which has been holding strongly since September. It has now moved back above the long-term support line and the daily 50 MA. As long as this holds, next resistance is at $73, which aligns with the downward channel resistance from the March 2022 high.
Gold is consolidating between the 2720 resistance and the 2605 support. It has now broken below the 2672 support/daily 50 MA (now resistance) again.
The US 10-Year yield defended the 4.21% support/daily 200 MA/50 MA and rose sharply, reversing course. It has now broken above the downward channel from the October 2023 high and hit the 4.40% resistance. Note the 50 MA crossing above the 200 MA.
The USDJPY defended the 150 support and broke above the daily 200 MA/50 MA/152 resistance (now support). Next resistance is at 155. Note the 50 MA is about to cross above the 200 MA.
Bitcoin is currently consolidating between the 94375 support and the all-time highs. Next resistance above the all-time high is around 105,500.
Semis, SOX has been rangebound since August and is currently trading above the daily 200 MA/50 MA. It remains in an upward channel from the October 2022 low.
Consumer Disc, XLY reached another all-time record high.
The Retail sector, XRT continues to consolidate at the February 2022 highs. It remains in an upward channel from the November 2023 low.
The Tech sector, XLK consolidated near the all-time record high. It remains in the upward channel from the January 2023 low.
Transports, IYT continued to move lower and has now broken below the daily 50 MA. It is also back inside the upward channel from the October 2022 low.
Financials sector, XLF sold off and back-tested a long-term resistance line. It remains in the upward channel from the October 2023 low.
The Materials sector, XLB continued to move lower and broke below the 200 MA. It is approaching the lows from the summer which could act as support and remains in the upward channel from the October 2022 low.
Industrials, XLI sold off and broke below the daily 50 MA.
The Health sector, XLV sold off back to the recent lows which is a strong support area. Note the daily 50 MA about to cross below the 200 MA.
Consumer Staples, XLP consolidated near the steeper upward channel support (blue line) and then broke below it, holding above the daily 50 MA.
Utilities, XLU sold off to the recent lows which is a strong support area. If this fails, next support is at the daily 200 MA.
The Energy sector, XLE broke below the uptrend line from the October 2020 low and is below the daily 50 MA/200 MA. It is approaching the recent lows.
YEAR-TO-DATE RETURN:
IXIC Nasdaq +33.7%
SPX S&P 500 +28.6%
DJIA Dow Jones +18.4%
XLF U.S. Financial Sector: +33.2%
XLY U.S. Consumer Disc Sector: +32.5%
SOX Semiconductor Index: +25.6%
XLU U.S. Utilities Sector: +25.4%
XLK U.S. Technology Sector: +24.8%
XLI U.S. Industrials Sector: +21.7%
XLP U.S. Consumer Staples Sector: +16.2%
XRT U.S. Retail Industry: +16.1%
XLE U.S. Energy Sector: +9.0%
IYT Dow Jones Transports: +7.7%
XLB U.S. Materials Sector: +5.7%
XLV U.S. Health Care Sector: +4.5%
Week of 12/16/2024:
Click link for complete Economic Calendar.
United States - Fed's interest rate decision, retail sales, PCE prices, personal income and spending, the final estimate of GDP growth, industrial production, manufacturing and services PMIs, building permits, housing starts, and existing home sales.
China - industrial production, retail sales, jobless rate, housing prices, and loan prime rates.
United Kingdom - the BoE's policy decision, inflation figures, retail sales, and jobs report.
Japan - the BoJ's interest rate decision, inflation and foreign trade data.
Interest Rate decisions - Mexico, the Philippines, Sweden, Norway, Indonesia, and Thailand.
Canada - inflation data.
Germany - Ifo business climate index and ZEW economic sentiment.
Euro Area - trade and PMI figures.
Keep reading with a 7-day free trial
Subscribe to PalmaFutures Newsletter to keep reading this post and get 7 days of free access to the full post archives.