


S&P500 E-mini Levels For 2/18/2025
$ES_F Analysis & Game Plan

Big Picture: Bias is Bullish, Market In Upward Channel From October 2023 Low, $VIX Below 20 (complacency)
Today´s Pivot is 6133
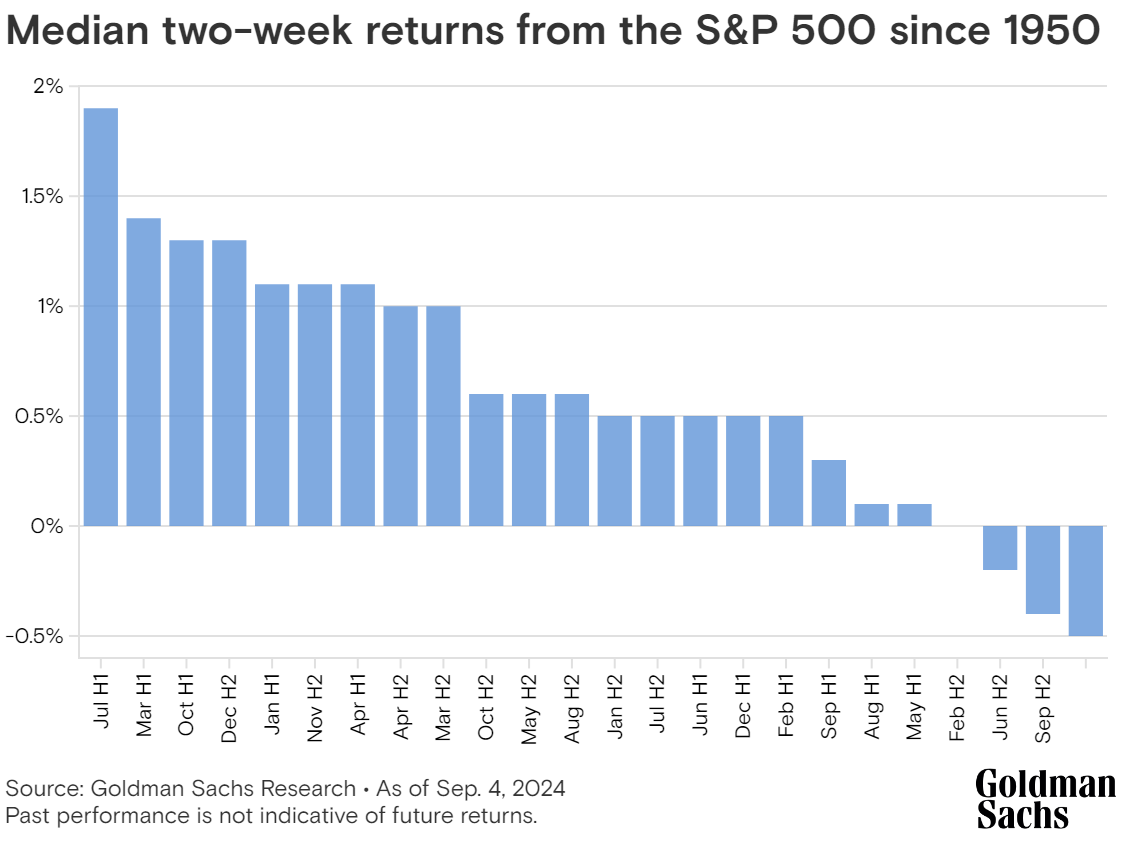
The historical average performance of the S&P 500 in the latter half of February has shown a tendency to underperform, as illustrated in the graph below. While these seasonal trends have been observed over time, they represent averages—not certainties. Market performance is influenced by a variety of factors, and seasonal patterns can vary from year to year. At present, the market is higher for the month of February. As shown in the daily ES chart posted in the Sunday Post, the market has been rangebound for some time and is currently trading near the top of this range. The key question now is whether the market will break out of this range and move higher to new all-time highs.
Market Analysis
Keep reading with a 7-day free trial
Subscribe to PalmaFutures Newsletter to keep reading this post and get 7 days of free access to the full post archives.