


Sunday Post - Recap & Week Ahead 1/12/2025

NOTE: Free subscribers will continue to receive the weekly Sunday Post, but it will not include the final section with the chart, key levels, and detailed analysis for the upcoming week. Upgrade to a paid subscription to unlock the full Sunday Post and gain exclusive access to subscriber-only daily game plans.
The US stock market endured another challenging week, with all major indexes falling approximately 2%. This marked the second consecutive weekly decline, reflecting investor apprehension over a potential slowdown in the pace of interest-rate cuts that had previously fueled market optimism. The S&P 500 cemented its fourth negative week out of the last five, which is now down over 4% from its all-time high in early December. Moreover, the decline in the stock market over the past two weeks has been accompanied by noticeable shifts in both market breadth and sentiment, highlighting increased investor caution. Here's a closer look at these dynamics:
Breadth indicators have weakened but are not quite yet at levels that normally align with market turnarounds.
Defensive sectors such as utilities & health care have shown relative resilience, while cyclical and growth-oriented sectors have borne the brunt of the selling pressure. Also, small-cap stocks, often seen as a proxy for risk appetite, have underperformed their large-cap counterparts.
Trading volume on down days has been significantly higher than on up days, indicating strong selling pressure. This pattern suggests that institutional investors may be de-risking their portfolios.
The CBOE Volatility Index (VIX) has risen toward the 20 level and Sentiment Surveys, such as the American Association of Individual Investors (AAII) survey, have shown an increase in Bearish sentiment.
The equity put/call ratio has risen, signaling an increase in hedging activity and a more defensive stance among traders.
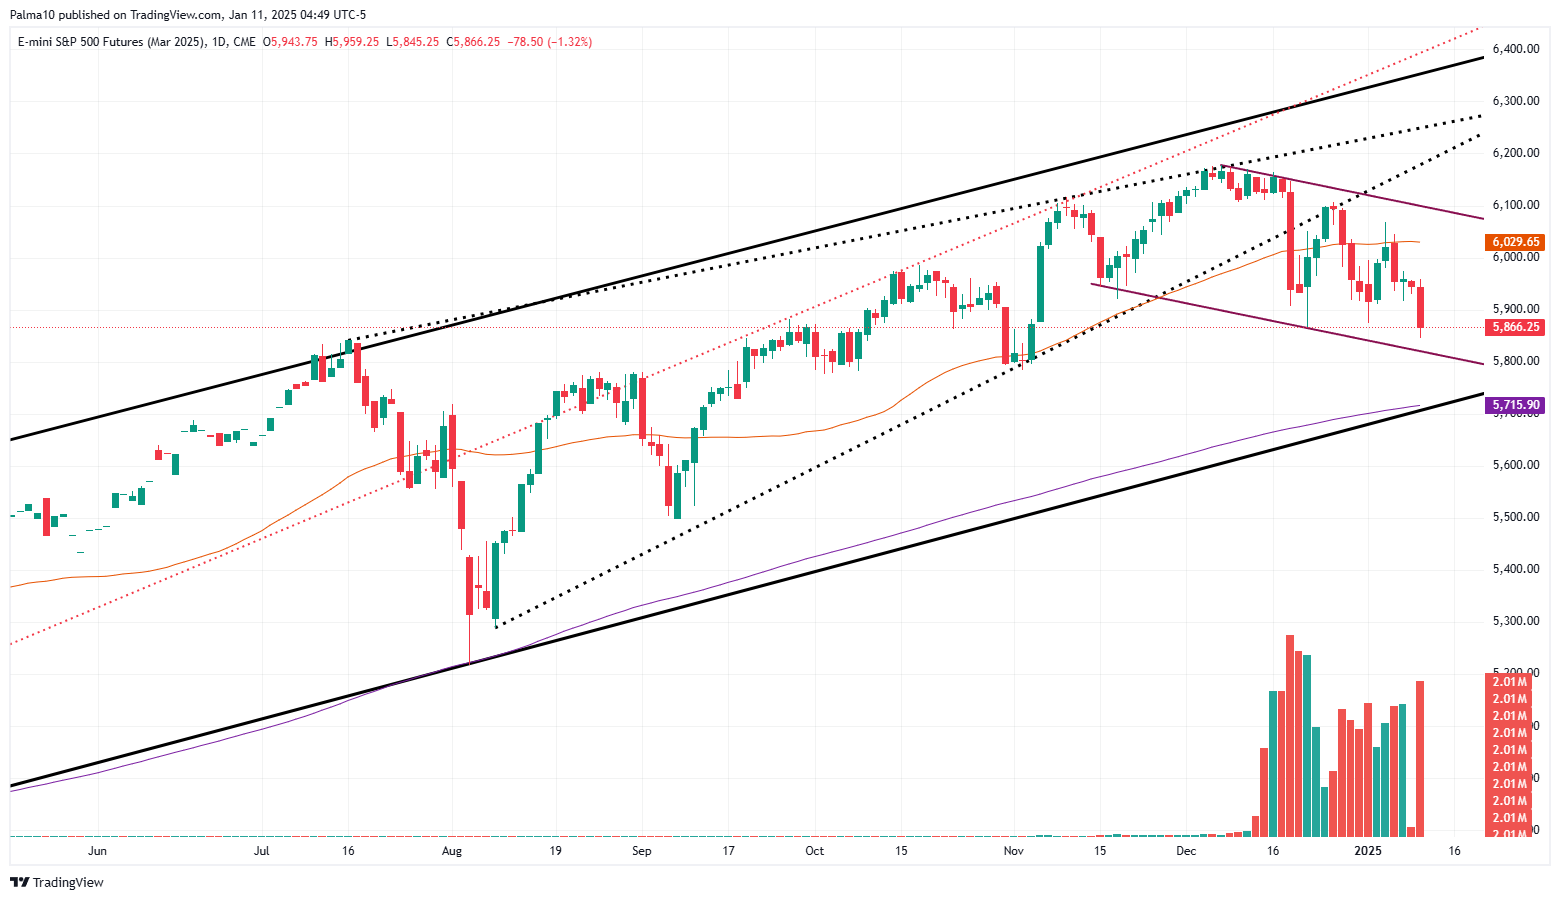
In the previous Sunday Post, I cautioned that the Buyers could encounter overhead resistance at the daily 50 MA and 20 MA (not shown), which would be a critical area for this week. It turns out that the daily 20 MA/50 MA did indeed face rejection early in the week, and the ES market sold off, breaking below the recent lows from the past two weeks. As shown in the daily chart below, the market is now in a small downward channel within the larger upward channel originating from the October 2023 low (black solid lines). In addition, the market is now at the July high and September high areas, which could act as support.
As usual, I will do a brief recap of this week´s market action, followed by an analysis of the general markets and the various sectors, and conclude with an outlook for the upcoming week.
Recap:
Early in the week, the ES market rallied higher, breaking above the daily 50 MA and moving to the top of the 5-Day Balance. However, this level was rejected, and the market sold off, erasing some of the gains. The market slipped back below the daily 50 MA, a development that was certainly discouraging for the Bulls. On Tuesday, the daily 50 MA was rejected again, and the losses extended as the market broke below the weekly pivot of 5967. Subsequently, the market consolidated around the lower part of the 5-Day Balance, during which the weekly pivot area was repeatedly rejected. On Friday, the market broke below the bottom of the Balance, achieving all downside targets. The Bearish scenario outlined in the previous Sunday Post played out perfectly, with the market finding support right at the final target for the week.
General Markets and Sectors:
Check out the updated Charts Page which goes with this section.
The S&P 500 initially broke above the daily 50 MA but was rejected at the 6009-resistance level, triggering a selloff back below the 50 MA and the 5870 support (now resistance). Next support is at 5762 which coincides with the upward channel support from the October 2023 low.
The NDX/Nasdaq was initially rejected at the 21625 resistance which led to a selloff breaking below the daily 50 MA and the 21171 support (now resistance). This market then found support at the 20675 level which coincides with the July high.
The Dow Jones initially made an attempt to move back inside the upward channel from the October 2023 low but failed which led to a selloff, breaking below the 42700 support (now resistance) and moving right to the 41915 support. Next support is at 41198 which coincides with the daily 200 MA and the July high.
Small Caps (IWM) sold off to the daily 200 MA after consolidating below the upward channel from the October 2023 low and the 227 level, which are resistances.
The FFTY index sold off below the daily 50 MA and then broke below the upward channel support from the August lows. If these areas are not reclaimed, next support is at the daily 200 MA.
The $VIX initially failed to move further down and then rallied to the 20 level, maintaining its Bullish stance.
Crude Oil defended the $73 support level and then rallied higher breaking above the daily 200 MA. The $77 resistance was hit but was rejected and closed below this level. If there´s traction, next resistance is at $85.
Gold continues to consolidate between the 2720 resistance and the 2605 support. The daily 50 MA and the 2672 resistance were reclaimed (now support).
The US 10-Year yield rallied higher to the 4.75% resistance which coincides with the April high. Support is at 4.60% and next resistance is at 4.89%.
The USDJPY continues to consolidate around the 157.75 resistance. If decisively broken, next resistance is at 160.
Bitcoin rallied to the 101275 resistance which was rejected leading to a selloff back down to the 92500 support. If this level is broken, next support is at 87300.
Semis, SOX has been rangebound since August and remains in an upward channel from the October 2022 low. It did break out of the triangular pattern but sold off moving back inside this pattern, closing below the daily 200 MA/50 MA.
Consumer Disc, XLY sold off to the upward channel support from the August low and closed slightly below the daily 50 MA, which could hold as support.
The Retail sector, XRT got rejected at the daily 50 MA and sold off towards the upward channel support from the November 2023 low. The 79 level must be reclaimed for the upside.
The Tech sector, XLK has been rangebound since November and sold off closing below the daily 50 MA. It remains in the upward channel from the January 2023 low.
Transports, IYT moved higher after consolidating above the daily 200 MA and remains in the upward channel from the October 2022 low.
Financials sector, XLF broke the upward channel support from the October 2023 low after some consolidation.
The Materials sector, XLB consolidated at the upward channel support from the October 2022 low.
Industrials, XLI consolidated around the August highs, which is acting as support for now. It remains in an upward channel from the March 2020 low.
The Health sector, XLV is consolidating in a strong support area and being defended for now. It is in a downtrend for the short term.
Consumer Staples, XLP sold off to the March highs which is also a support area.
Utilities, XLU consolidated above the daily 200 MA, which is also a strong support area.
The Energy sector, XLE moved higher to the daily 50 MA and was rejected. Note that this market has been rangebound for at least two years (shaded area).
YEAR-TO-DATE RETURN:
IXIC Nasdaq -0.8%
SPX S&P 500 -0.9%
DJIA Dow Jones -1.4%
XLE U.S. Energy Sector: +3.2%
IYT Dow Jones Transports: +1.8%
XLV U.S. Health Care Sector: +1.5%
SOX Semiconductor Index: +0.2%
XLU U.S. Utilities Sector: -0.1%
XLI U.S. Industrials Sector: -0.3%
XRT U.S. Retail Industry: -0.7%
XLB U.S. Materials Sector: -1.0%
XLK U.S. Technology Sector: -1.6%
XLY U.S. Consumer Disc Sector: -1.6%
XLF U.S. Financial Sector: -2.1%
XLP U.S. Consumer Staples Sector: -2.9%
Week of 1/13/2025:
Click link for complete Economic Calendar.
United States - CPI and PPI reports. Also, earnings season kicks into gear, with major banks including JPMorgan Chase, Wells Fargo, Goldman Sachs, Citigroup set to report their quarterly results.
China - Q4 GDP growth figures, data on exports & imports, industrial production, and retail sales.
United Kingdom - key reports on inflation, monthly GDP and retail sales.
Euro Area - European Central Bank minutes and final inflation figures.
Keep reading with a 7-day free trial
Subscribe to PalmaFutures Newsletter to keep reading this post and get 7 days of free access to the full post archives.