


Sunday Post - Recap & Week Ahead 3/9/2025

NOTE: Free subscribers will continue to receive the weekly Sunday Post, but it will not include the final section with the chart, key levels, and detailed analysis for the upcoming week. Upgrade to a paid subscription to unlock the full Sunday Post and gain exclusive access to subscriber-only daily game plans.
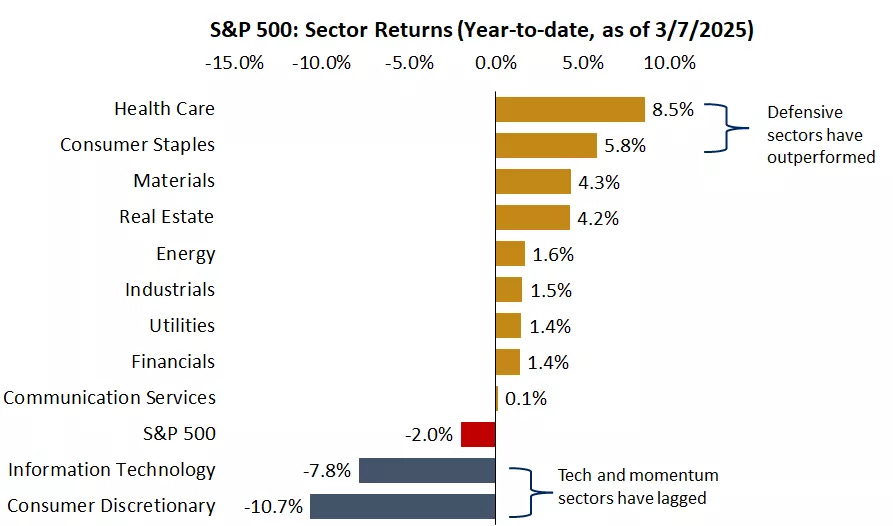
The S&P 500 index declined approximately 3.1% for the week, testing key technical levels such as the daily 200 MA. This drop marked the steepest weekly decline since September 2024. The Nasdaq fell around 3.5%, with technology stocks experiencing significant corrections. Meanwhile, the Dow Jones trimmed its losses, ending the week down approximately 2.4%. The market saw a noticeable rotation away from growth and high-tech stocks toward more defensive sectors, such as consumer staples and healthcare. The graph below illustrates the YTD performance of different sectors within the S&P 500.
Source: FactSet
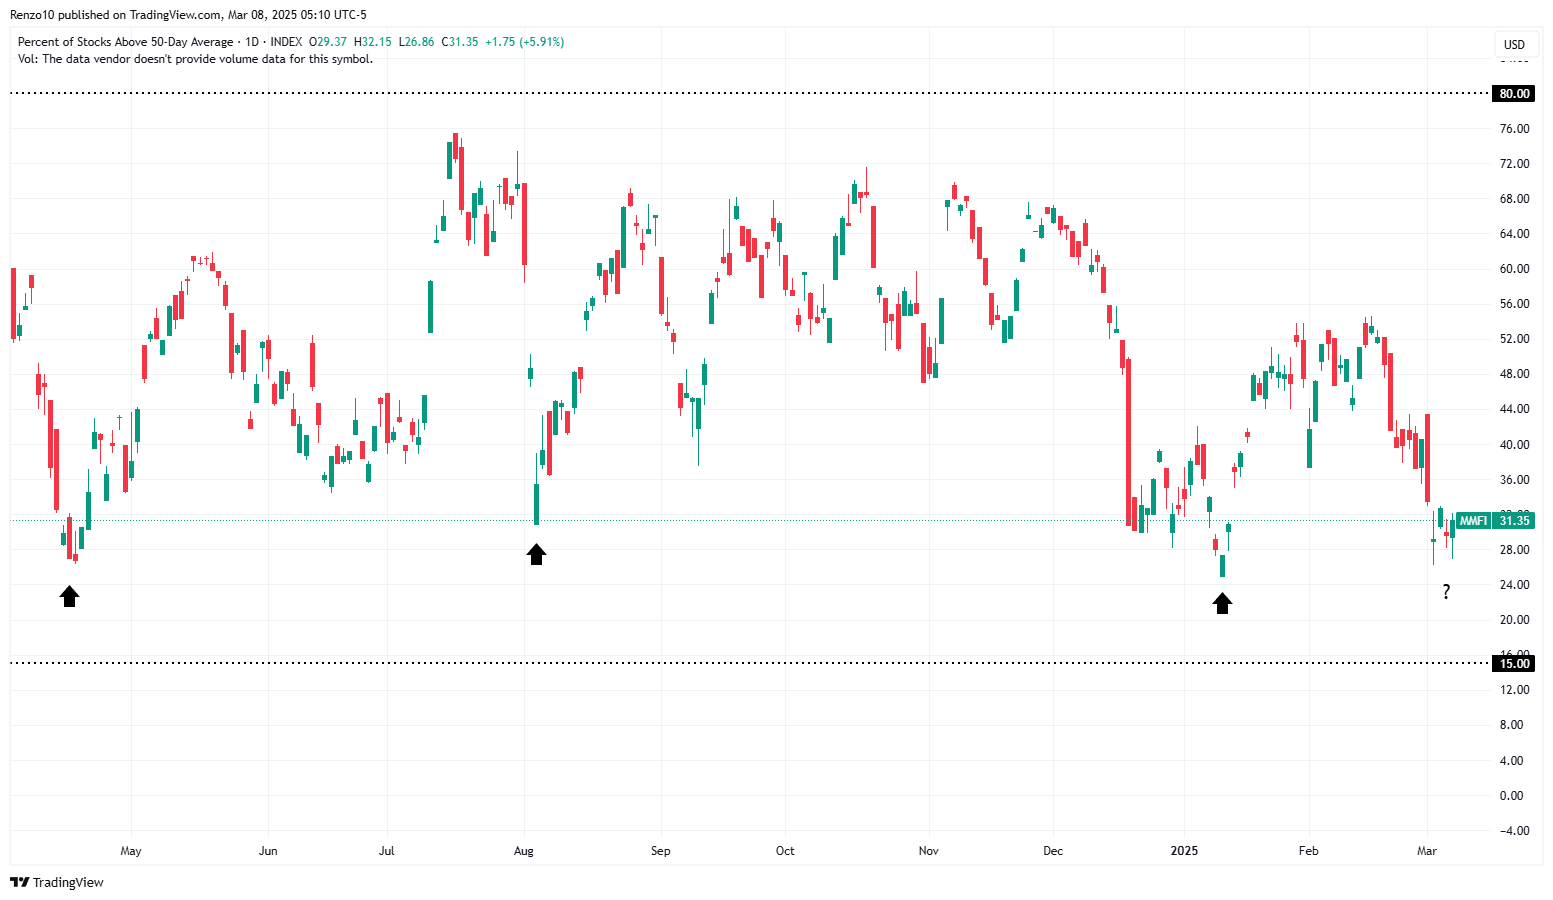
With that said, market sentiment remains at the “extreme fear” level and market breadth has reached levels historically associated with prior market bottoms. Currently, the percentage of S&P 500 stocks trading above their 50-day MA is around levels seen in mid-April 2024, early August 2024, and mid-January 2025—all of which coincided with market reversals (black arrows on the chart below). Whether this pattern holds true again remains to be seen.
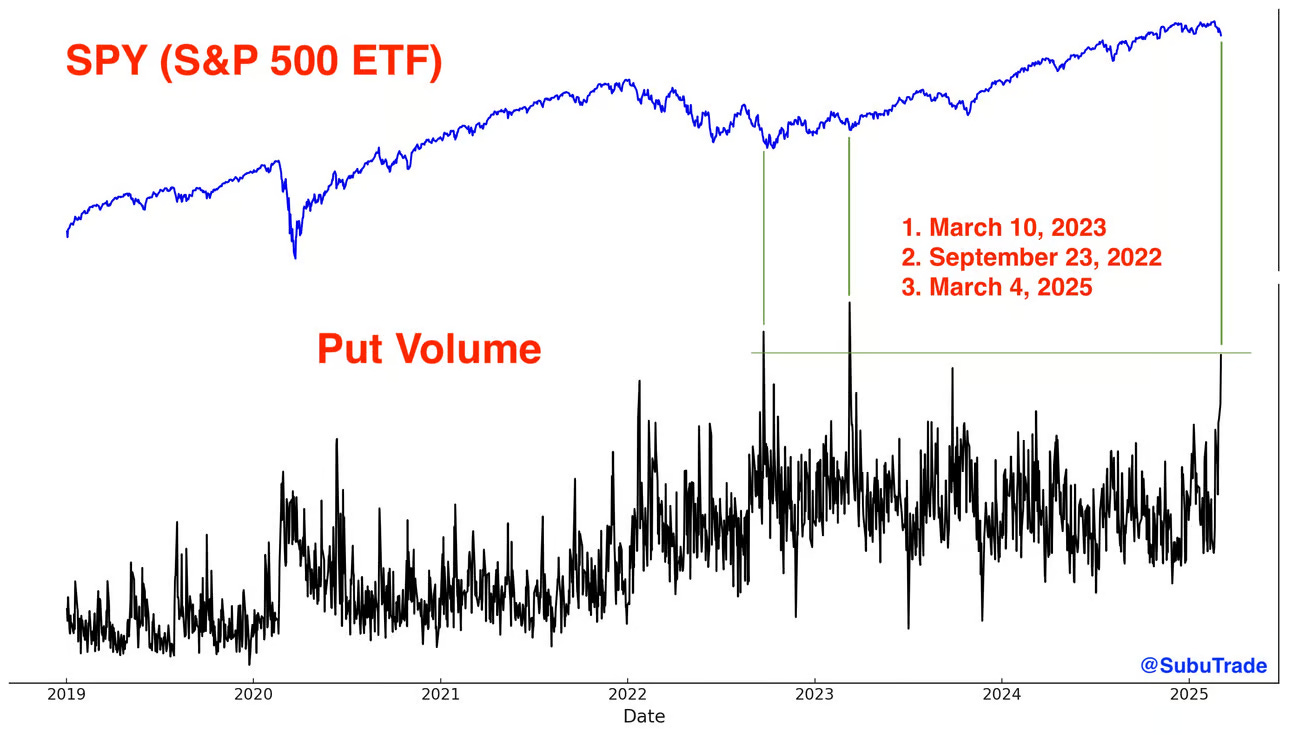
In addition, SPY put volume spiked on Tuesday to the 3rd highest in history. The previous two spikes were bottoms for the S&P 500. See chart below.
h/t: Subu Trade
The ES futures market broke the downward channel support originating from the October 2023 low and also breached the lower boundary of the recent sideways range (highlighted in light blue on the daily chart below). The daily 200 MA was then rejected after an attempt to reclaim it. However, Friday’s rally formed a reversal pattern, offering a glimmer of optimism despite the overall cautious sentiment prevailing in the market.

As usual, I will do a brief recap of this week´s market action, followed by an analysis of the general markets and the various sectors, and conclude with an outlook for the upcoming week.
Recap:
The Bearish scenario outlined in the previous Sunday Post played out once again with precision. Early in the week, the ES market broke below the weekly Pivot of 5960 and the lower boundary of the prior 28-Day Balance area—a key technical requirement for further downside, as outlined in the plan. Following this breakdown, the market sold off sharply, reaching and exceeding all downside targets by Tuesday. Subsequently, some consolidation took place within a wide range before selling off and making a new low for the week. On Friday, the market staged a rally, forming a reversal pattern. However, a follow-through day will be needed to confirm any sustained upside momentum. Despite Friday’s rebound, the market remains in a Bearish Imbalance phase.
General Markets and Sectors:
Check out the updated Charts Page which goes with this section.
The S&P 500 broke below the 5870-support level (now resistance), which aligns with the upward channel support from the October 2023 low. It also briefly dipped below the daily 200 MA, heading toward the 5638-support level, before closing above the MA at the 5770 support. A potential bounce is possible.
The NDX/Nasdaq broke below the 20675 support (now resistance) and then the daily 200 MA. It bounced off the upward channel support from the January 2023 low and reclaimed the 19978 support. Also, there could a potential bounce.
The Dow Jones broke below the 43276 support (now resistance), which aligns with the upward channel support from the October 2023 low and the 42700 support, heading toward the daily 200 MA. It then reclaimed the 42700 support.
Small Caps (IWM) broke below the 212-support level (now resistance) and moved lower toward the 200 support.
The FFTY index broke below the daily 200 MA and bounced off the upward channel support from the October 2023 low. Need to see follow through.
The $VIX rallied higher from the 20 level and reached the December high. It remains Bullish, so the stock market is not quite yet out of the woods.
Crude Oil broke below the long-term uptrend line and moved back inside the downward channel from the March 2022 high. It has found support at $67 again, which held several times last fall of 2024. Next support is at $58.
Gold bounced off the 2865 support level and moved higher toward the 2939 resistance. Next major support is at the 2787 level, which aligns with the previous October high. It remains in an upward channel from the February 2024 low.
The US 10-Year yield was able to defend the 4.21% support/daily 200 MA, which aligns with the back-test of the downward channel from the October 2023 high. If this area holds, next resistance is at 4.40%, if not, next support is at 4.0%.
The USDJPY sold off and broke below the 150 - 148.50 support area (now resistance). Next support is at 145, which aligns with the upward channel support from the January 2021 low.
Bitcoin is consolidating between the 92500 resistance and the daily 200 MA, which is acting as support. It is now back inside the upward channel from the October 2023 low.
Semis, SOX sold off to the upward channel support from the October 2022 low and is being defended. There could be a potential bounce.
Consumer Disc, XLY sold off and moved back inside the gradual upward channel from the December 2022 low. It has found support at the daily 200 MA.
The Retail sector, XRT continued to move lower and is being defended at a strong support zone around the August 2024 low. It could see a rebound.
The Tech sector, XLK broke below the upward channel support from the October 2022 low. It is consolidating below this area and a move back inside the channel would be quite Bullish.
Transports, IYT broke below the daily 200 MA and consolidated. It remains in the upward channel from the October 2022 low.
Financials sector, XLF sold off sharply breaking below the daily 50 MA and the upward channel support from the October 2023 low.
The Materials sector, XLB consolidated around the daily 50 MA and remains in the upward channel from the October 2022 low.
Industrials, XLI broke below the daily 50 MA and found support at the 200 MA. It remains in an upward channel from the March 2020 low.
The Health sector, XLV is consolidating above the daily 200 MA.
Consumer Staples, XLP is consolidating around the November/December highs.
Utilities, XLU broke below the daily 50 MA and moved lower to the upward channel support from the October 2023 low (also 200 MA), which got defended.
The Energy sector, XLE broke below the daily 200 MA/50 MA and moved lower toward the December lows. Note that this market has been rangebound for at over two years (shaded area).
YEAR-TO-DATE RETURN:
DJIA Dow Jones +0.9%
SPX S&P 500 -1.8%
IXIC Nasdaq -5.7%
XLV U.S. Health Care Sector: +8.5%
XLP U.S. Consumer Staples Sector: +5.4%
XLB U.S. Materials Sector: +4.4%
XLU U.S. Utilities Sector: +2.1%
XLE U.S. Energy Sector: +2.1%
XLI U.S. Industrials Sector: +1.9%
XLF U.S. Financial Sector: +1.6%
IYT Dow Jones Transports: +1.2%
XLK U.S. Technology Sector: -6.0%
SOX Semiconductor Index: -7.8%
XLY U.S. Consumer Disc Sector: -8.3%
XRT U.S. Retail Industry: -9.9%
Week of 3/10/2025:
Click link for complete Economic Calendar.
United States - inflation rate, producer inflation, JOLTS job openings, and the Michigan consumer sentiment index.
UK - January GDP growth, industrial production, and the goods trade balance.
Germany - trade balance and industrial production data.
Canada - interest rate decision.
China - CPI and PPI print, new yuan loans, money supply and car sales data.
Inflation figures - India, Brazil, Russia, and Poland.
Industrial production data - Turkey, Brazil, India, and the Euro Area. Australia - NAB business confidence and Westpac consumer confidence.
Keep reading with a 7-day free trial
Subscribe to PalmaFutures Newsletter to keep reading this post and get 7 days of free access to the full post archives.