


Sunday Post - Recap & Week Ahead 3/2/2025

NOTE: Free subscribers will continue to receive the weekly Sunday Post, but it will not include the final section with the chart, key levels, and detailed analysis for the upcoming week. Upgrade to a paid subscription to unlock the full Sunday Post and gain exclusive access to subscriber-only daily game plans.
For the week, the major US indexes diverged in their performance. The Dow Jones managed to notch a modest gain of about 1.0%, while the broader S&P 500 fell roughly 1.0%. In contrast, the Nasdaq suffered a steeper decline of approximately 3.5%. The month of February proved to be a challenging month. The tech-focused Nasdaq posted its worst monthly decline since April 2024—dropping about 4%—while the S&P 500 and the Dow Jones fell 1.4% and 1.6%, respectively. Moreover, the “Magnificent 7” group has shifted from a leader to a laggard in 2025, now entering correction territory, while the broader index has remained rangebound over the past three months. See chart below:
h/t: Edward Jones

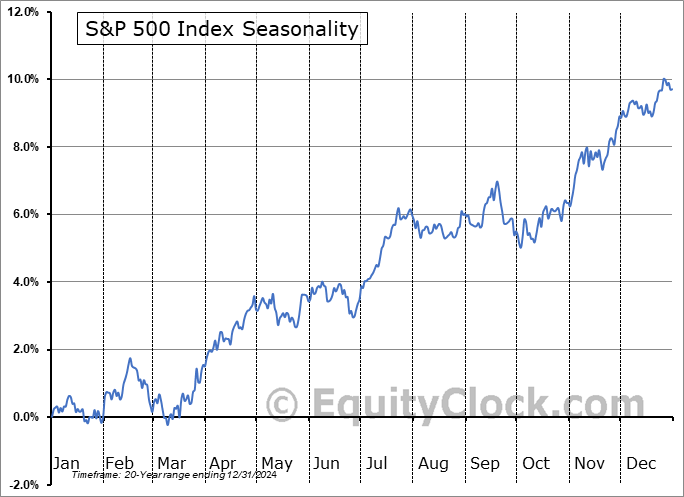
Regarding S&P 500 seasonality, February followed historical patterns closely, with the first half of the month moving higher before selling off in the latter half. As illustrated in the chart below, March tends to exhibit the opposite pattern—underperformance and volatility in the first half, followed by a rally in the second half.
After facing resistance at the daily 50 MA, the ES market sold off to test the upward channel support originating from the October 2023 low (black solid lines). On Friday, the market bounced off this key support, as shown in the daily chart below. Notably, the market has remained rangebound since early November and continues to trade above the rising daily 200 MA. Moving forward, the confluence of the lower boundary of the sideways range, the daily 200 MA, and the upward channel support forms a critical support zone.

As usual, I will do a brief recap of this week´s market action, followed by an analysis of the general markets and the various sectors, and conclude with an outlook for the upcoming week.
Recap:
Once again, the Bearish scenario from the prior Sunday Post played out precisely as written, given that the weekly Pivot of 6073 had to be defended for further downside. The ES market topped at 6067.50 early in the week before selling off and breaking below the daily 50 MA. It continued lower, reaching the bottom of the 28-Day Balance area by Tuesday. Although this level was briefly breached, the market quickly moved back inside the Balance range. The bottom of the Balance was retested on Wednesday, followed by another bounce higher. However, it wasn’t until Thursday that the Balance area definitively broke after a fierce battle between Buyers and Sellers around its lower boundary. The final target for the week was then reached and even exceeded. By Friday afternoon, the market found support, aligning with the upward channel support illustrated in the daily chart above. This led to a strong reversal higher, bringing the market back into the lower part of the prior Balance range. While Friday’s late-afternoon rally was encouraging for the Bulls, a follow-through day will be needed to confirm further upside momentum.
General Markets and Sectors:
Check out the updated Charts Page which goes with this section.
The S&P 500 broke below the 6009 support/daily 50 MA (now resistances) and sold off to the 5870 level, which aligns with the upward channel support from the October 2023 low. The market then bounced off this area.
The NDX/Nasdaq broke below the 21625 support/daily 50 MA (now resistances) and sold off to the 20675 support. This level was briefly broken but was reclaimed on Friday. Next support is at the daily 200 MA and resistance is at 21171.
The Dow Jones consolidated between the 43276 support (aligns with the upward channel support from the October 2023 low) and the 43730 resistance (near daily 50 MA). Next resistance is at 44359.
Small Caps (IWM) broke the upward channel support last week and the losses were extended moving below the daily 200 MA. It has now found support at the 212 level, which could lead to a rebound.
The FFTY index sold off to the daily 200 MA and consolidated in this area. This market remains in the upward channel from the October 2023 low.
The $VIX moved higher and reclaimed the 20 level, but this area got rejected on Friday. However, it remains Bullish, so the stock market is not quite yet out of the woods.
Crude Oil continues to back-test the downward channel from the March 2022 high. It has also found support at a long-term uptrend line. Let´s see if this area holds, if not, next support is at $67.
Gold sold off to the 2865 support level after making another all-time record high. Next support is at the 2787 level, which aligns with the previous October high. It remains in an upward channel from the February 2024 low.
The US 10-Year yield sold off to the 4.21% support/daily 200 MA, which aligns with the back-test of the downward channel from the October 2023 high. If this area holds, next resistance is at 4.40%, if not, next support is at 4.0%.
The USDJPY found support at 148.50 and after some basing moved higher breaking above the 150 resistance (now support). Next resistance is at 152/daily 200 MA.
Bitcoin sold off breaking below the 92500 support and the 87300 support (now resistances). The losses were extended moving below the daily 200 MA and the 80425 support but both levels were reclaimed. This market is now back inside the upward channel from the October 2023 low.
Semis, SOX has been rangebound since August and the lower boundary was broken this week. It remains in an upward channel from the October 2022 low.
Consumer Disc, XLY moved to the gradual upward channel from the December 2022 low and consolidated in this area. Let´s see if this holds as support.
The Retail sector, XRT extended its losses and broke the October lows. It is now approaching a strong support zone around the August 2024 low.
The Tech sector, XLK broke the daily 50 MA and sold off to the upward channel support from the October 2022 low (near 200 MA). It looks like this area is holding as support, but the 200 MA must be reclaimed for the upside.
Transports, IYT consolidated between the daily 50 MA and the 200 MA. It remains in the upward channel from the October 2022 low.
Financials sector, XLF sold off to the daily 50 MA which aligns with the upward channel support from the October 2023 low. The market then moved higher to the all-time high.
The Materials sector, XLB consolidated above the daily 50 MA and remains in the upward channel from the October 2022 low.
Industrials, XLI consolidated below the daily 50 MA and next support is at the 200 MA. It remains in an upward channel from the March 2020 low.
The Health sector, XLV has been consolidating around the daily 200 MA since late January and is now back above it.
Consumer Staples, XLP moved higher and briefly broke above the November/December highs before selling off below it.
Utilities, XLU has been rangebound since January and currently holding above the daily 50 MA. It remains in the upward channel from the October 2023 low.
The Energy sector, XLE is consolidating around the daily 200 MA/50 MA. Note that this market has been rangebound for at over two years (shaded area).
YEAR-TO-DATE RETURN:
DJIA Dow Jones +3.3%
SPX S&P 500 +1.4%
IXIC Nasdaq -2.3%
XLV U.S. Health Care Sector: +8.3%
XLF U.S. Financial Sector: +8.0%
XLE U.S. Energy Sector: +6.2%
XLP U.S. Consumer Staples Sector: +5.7%
XLB U.S. Materials Sector: +5.5%
XLU U.S. Utilities Sector: +4.7%
XLI U.S. Industrials Sector: +3.5%
IYT Dow Jones Transports: +3.4%
XLK U.S. Technology Sector: -3.0%
XLY U.S. Consumer Disc Sector: -3.7%
SOX Semiconductor Index: -5.1%
XRT U.S. Retail Industry: -6.8%
Week of 3/3/2025:
Click link for complete Economic Calendar.
United States - January labor report, ISM Manufacturing & Services PMI, factory orders, foreign trade data, and speeches by Federal Reserve officials. Euro Area - ECB interest rate decision, January inflation data, and the unemployment rate.
Turkey - interest rate decision.
Inflation figures - the Netherlands, Philippines, Switzerland, South Korea, Mexico, and Turkey.
Unemployment Rates - Japan and Canada.
GDP growth rates - South Africa, Australia and Brazil.
Trade Balance data - Australia, Canada and China.
Manufacturing & Services PMI data - China, Spain and Italy.
Keep reading with a 7-day free trial
Subscribe to PalmaFutures Newsletter to keep reading this post and get 7 days of free access to the full post archives.