


Sunday Post - Recap & Week Ahead 2/23/2025

NOTE: Free subscribers will continue to receive the weekly Sunday Post, but it will not include the final section with the chart, key levels, and detailed analysis for the upcoming week. Upgrade to a paid subscription to unlock the full Sunday Post and gain exclusive access to subscriber-only daily game plans.
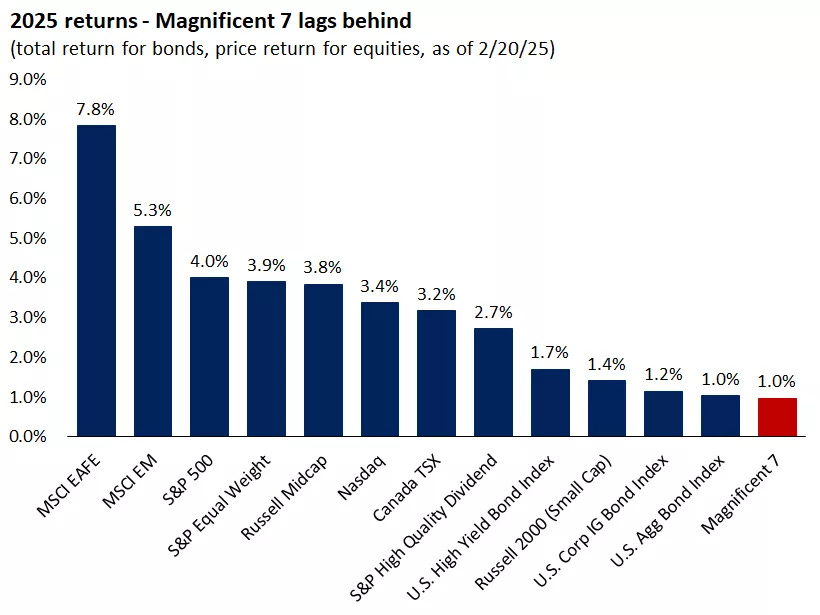
The S&P 500 and Dow Jones both suffered losses in the latter part of the week, with the S&P 500 declining roughly 1.7% over the week and the Dow Jones falling about 2.5%. The Nasdaq and small‑cap Russell 2000 also posted similar declines as market participants digested weak retail sales and economic data. So far in 2025, US mega-cap technology stocks have underperformed compared to most other asset classes. As the year unfolds, several key trends are emerging, including a broadening of US stock market leadership, the stabilization of government bond yields and outperformance by European and global equities. See the graph below for a visual breakdown.
Source: Edward Jones
Once again, the ES market failed to break out of its sideways range, facing rejection at the upper boundary and leading to a major sell-off on Friday. As a result, the market has closed back below the 50 MA, as shown in the daily chart below. Despite remaining rangebound since early November, it continues to trade within an upward channel extending from the October 2023 low (black solid lines).

As usual, I will do a brief recap of this week´s market action, followed by an analysis of the general markets and the various sectors, and conclude with an outlook for the upcoming week.
Recap:
This week, I provided three cautionary insights ahead of Friday’s sell-off.
First, in my Tuesday post, I highlighted that the S&P 500 has historically underperformed in the latter half of February. Then, in Wednesday’s post, I warned about the risks of failed breakouts of the Balance which often present strong counter-trade opportunities. True to this pattern, the ES market initially broke above the now 25-Day Balance area on Wednesday, only for the breakout to fail the next day, sending the market back inside the Balance range. Third, in Thursday’s post, I pointed out the Bearish divergences from the technical indicators across multiple time frames, which contributed to the initial sell-off that day. After failing to reach the top of the Balance area, the market then sold off sharply on Friday. The Bearish scenario from my prior Sunday Post played out almost perfectly as the Sellers managed to defend top of the Balance, which resulted in a selloff and nearly all downside targets were reached for the week. In fact, the market bottomed within the second-to-last target zone.
General Markets and Sectors:
Check out the updated Charts Page which goes with this section.
The S&P 500 made another all-time record high but lacked traction and sold off right to the 6009 support/daily 50 MA. If this fails, next support is at 5870.
The NDX/Nasdaq made an all-time record high and then sold off to the 21625 support/daily 50 MA. If this fails, next support is at 21171.
The Dow Jones sold off sharply breaking below the upward channel support from the October 2023 low and the 43730 support/daily 50 MA (now resistances). The market has found support at 43276 for now.
Small Caps (IWM) sold off and broke below the 227 support and the daily 50 MA (now resistances). The market has found support at the 200 MA.
The FFTY index sold off sharply from the June 2022 highs and broke below the upward channel support from the August lows (also daily 50 MA). Next support is at the 200 MA.
The $VIX rallied higher and is starting to look Bullish. Watch the 20 level.
Crude Oil initially rallied higher but was rejected at the $73 resistance, as well as the daily 50 MA. It is now back-testing the downward channel from the March 2022 high one more time. Let´s see if this area holds, if not, next support is at $67.
Gold made another all-time record high but looks quite extended. Supports are at the 2865 level and the 2787 level, which aligns with the previous October high.
The US 10-Year yield got rejected at the 4.57% resistance/daily 50 MA and sold off to the 4.40% support. If this fails, next support at 4.21%/daily 200 MA.
The USDJPY got rejected at the 152 resistance/daily 200 MA and sold off breaking below the 150 support (now resistance). It has moved toward the 148.50 support.
Bitcoin continues to consolidate between the 106175 resistance (near all-time high) and the 92500 support. It is trading below the daily 50 MA.
Semis, SOX has been rangebound since August and sold off to the daily 200 MA/50 MA. It remains in an upward channel from the October 2022 low.
Consumer Disc, XLY extended its losses and moved toward the gradual upward channel from the December 2022 low, which could act as support.
The Retail sector, XRT broke below the upward channel support from the November 2023 low and sold off sharply breaking below the daily 200 MA. It has found support at the October lows for now.
The Tech sector, XLK has been rangebound since November and moved higher breaking out to a new all-time record high, which was short-lived. The market sold off moving back inside the sideways range and broke below the daily 50 MA. It remains in the upward channel from the January 2023 low.
Transports, IYT got rejected again at the upward channel resistance from the October 2022 low and sold off to the daily 50 MA.
Financials sector, XLF moved higher to the all-time high before selling off. Next support is at the daily 50 MA. It remains inside the upward channel from the October 2023 low.
The Materials sector, XLB got rejected at the daily 200 MA and sold off to the 50 MA. It remains in the upward channel from the October 2022 low.
Industrials, XLI sold off below the daily 50 MA and next support is at the 200 MA. It remains in an upward channel from the March 2020 low.
The Health sector, XLV has been consolidating around the daily 200 MA since late January.
Consumer Staples, XLP continued to move higher after defending the daily 200 MA/50 MA. It is approaching the December highs.
Utilities, XLU moved higher to the January highs. It remains in the upward channel from the October 2023 low.
The Energy sector, XLE broke above the daily 200 MA/50 MA. Note that this market has been rangebound for at least two years (shaded area).
YEAR-TO-DATE RETURN:
DJIA Dow Jones +2.1%
SPX S&P 500 +2.2%
IXIC Nasdaq +1.1%
XLV U.S. Health Care Sector: +6.4%
XLE U.S. Energy Sector: +6.2%
XLU U.S. Utilities Sector: +6.1%
XLF U.S. Financial Sector: +5.0%
XLB U.S. Materials Sector: +4.7%
XLP U.S. Consumer Staples Sector: +4.5%
IYT Dow Jones Transports: +3.9%
XLI U.S. Industrials Sector: +2.3%
SOX Semiconductor Index: +2.2%
XLK U.S. Technology Sector: +1.0%
XLY U.S. Consumer Disc Sector: -2.7%
XRT U.S. Retail Industry: -5.4%
Week of 2/24/2025:
Click link for complete Economic Calendar.
United States - personal income & spending, PCE price indices, durable goods orders, the second estimate of Q4 GDP growth, CB consumer sentiment, the S&P/Case-Shiller Home Price YoY data, and new & pending home sales. Also, speeches by several Federal Reserve officials.
Inflation figures - France, Italy, Germany, Spain, South Africa, and Australia.
GDP growth rates - Switzerland, Turkey, Brazil, India, and Canada.
Germany - Ifo Business Climate Index, GfK consumer confidence, and retail sales figures.
Keep reading with a 7-day free trial
Subscribe to PalmaFutures Newsletter to keep reading this post and get 7 days of free access to the full post archives.