


Sunday Post - Recap & Week Ahead 6/8/2025
Stock Market Analysis and Insights, Charts and Levels

PLEASE SEE INTRO POST AND READ DISCLAIMER & INTELLECTUAL PROPERTY SECTIONS
NOTE: Free subscribers will continue to receive the weekly Sunday Post, but it will not include the final section with the chart, key levels, and detailed analysis for the upcoming week. Upgrade to a paid subscription to unlock the full Sunday Post and gain exclusive access to subscriber-only daily game plans.
The US stock market advanced across the board for the week, underpinned by a stronger-than-expected May jobs report and growing optimism. The S&P 500 rose 1.5%, the Nasdaq gained 2.2%, the Dow Jones added 1.2%, and the small‑cap Russell 2000 rallied 3.2%, reflecting a broad‑based rebound in risk assets. All sectors posted gains, led by Technology, Consumer Discretionary, and Small Caps, while defensives lagged modestly. Investors showed increased confidence as volatility declined—the VIX fell to 16.8, the lowest level in over three months. The AAII Bullish sentiment reading stood at 32.7%, below its long-term average of ~37%, indicating cautious optimism. Meanwhile, the CNN Fear & Greed Index remained in “Greed” territory at approximately 63. Market breadth was positive overall, with advancing issues outpacing declining ones on both the NYSE and Nasdaq.
Bond yields rose on inflation and fiscal concerns: the 10‑Year Treasury yield increased to 4.507%, while the 30‑Year yield held near 5.00%, putting modest downward pressure on bond prices. Bitcoin (BTC) rose 1.2% over the week, closing around $105,500. Despite the price rise, $131.6 million in net outflows from US-listed spot Bitcoin ETFs were recorded. The redemptions were led by Fidelity’s FBTC and Grayscale’s GBTC, partially offset by inflows into BlackRock’s IBIT—suggesting mixed institutional sentiment even amid broader market optimism.
Overall, this week’s narrative was one of confidence returning to equities, supported by strong payroll data, declining volatility, and broad sector participation. Bond yields climbed, reflecting economic resilience and inflation concerns, while Bitcoin’s price advance was tempered by institutional outflows. The market tone is cautiously optimistic, with investors embracing economic strength but remaining mindful of potential macro and bond‑market headwinds.
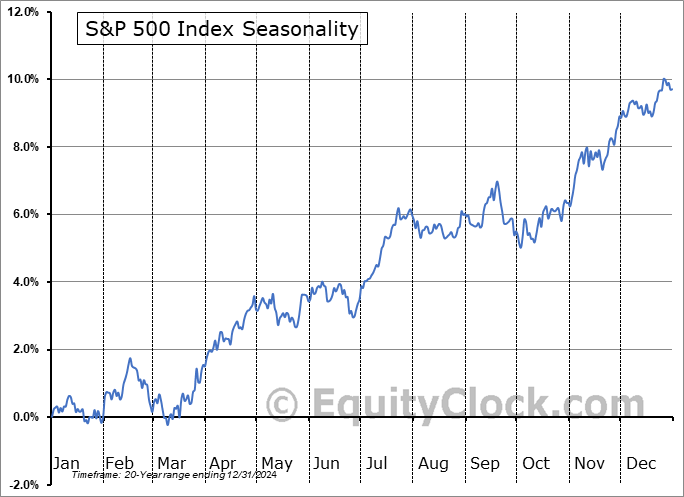
With respect to the S&P 500 seasonality, June is a mixed-to-cautious month as the momentum tends to plateau early, with the index showing choppy or sideways movement during the first half of the month. There’s modest upside bias in the second half, but overall, gains in June are relatively muted. See the chart below.
Typical behavior: Early June often sees consolidation after spring rallies.
Volatility: Intra-month pullbacks are common, making June a potential "wait-and-see" month for institutional flows.
Performance trend: Average returns in June hover just above flatline—around +0.5% to +1.0% for the month, historically.
Setup for July: June often acts as a base-building month that sets the stage for stronger gains in July, which historically shows one of the best performance trends of the year.
The ES market continued to consolidate this week, making several attempts to break above the multi-day Balance area. On Friday, it successfully closed above this range, but follow-through is needed to confirm the breakout. See the daily chart below. Previous resistance levels—such as the top of the Balance area, the daily 200 MA, and the 5845 level—now act as strong supports. Price action remains within the upward channel that began at the April lows.

As usual, I will do a brief recap of this week´s market action, followed by an analysis of the general markets and the various sectors, and conclude with an outlook for the upcoming week.
Recap:
A key battleground zone—encompassing the daily 200 MA and the weekly Pivot of 5912—was reclaimed early in the week, fulfilling the primary condition for the Bullish scenario outlined in the prior Sunday Post analysis. From there, the ES market rallied to the top of the multi-day Balance area and made several attempts to break above it. However, each attempt initially failed, resulting in consolidation and a meaningful pullback on Thursday.
On Friday, the market rebounded and finally broke above the Balance high, though the Sellers remained active in trying to contain the move. By this point, a good portion of the week’s upside targets had been met. Price briefly dipped back into the Balance area before the Buyers regained control. Some back-and-forth action followed near the top of the Balance, but the Buyers ultimately managed to secure a close above the range. Overall, it was a win for the Bulls, though follow-through remains key. The top of the Balance now serves as immediate support.
General Markets and Sectors:
Check out the updated Charts Page which goes with this section.
The S&P 500 defended the 5870 support early on and rallied, breaking above the recent highs to reach the 6009-resistance level. It is just 2.5% away from the all-time high.
The NDX/Nasdaq defended the 21171-support level and rallied, breaking above the 21625 resistance (now support). Next resistance is at 22100, which is close to the all-time high. Market remains inside the upward channel from the December 2022/January 2023 lows.
The Dow Jones defended the 41915 support and rallied breaking above the daily 200 MA, as well as the downtrend line from the all-time high and the 42700 resistance. Need to see some follow through.
Small Caps (IWM) finally broke above the downward channel resistance from the November 2024 high and reached the 212 resistance. This is a good first step but needs to reclaim the daily 200 MA for more upside.
The FFTY index continues to grind higher and remains inside the upward channel from the October 2023 low.
The $VIX sold off further down and remains technically weak which reflects a generally Bullish environment for equities.
Crude Oil reclaimed the daily 50 MA and then broke above the downward channel resistance from the March 2022 high. Need to see some follow through and next resistance is at $67.
Gold consolidated above the 3288 support. Next resistance is at 3424 and next support is at the daily 50 MA/3210 level.
The US 10-Year defended the daily 50 MA and then rallied breaking above the 4.40% resistance (now support). Next resistance is at 4.57%. It remains in the downward channel from the October 2023 high.
The USDJPY has been consolidating between the 145 resistance/daily 50 MA and the 141.75 support. It remains Bearish since the July 2024 highs.
Bitcoin sold off to the 101275 support/daily 50 MA and then bounced back higher. Resistance is at 106175. It remains in the upward channel from the October 2023 low.
Semis, SOX defended the upward channel support from the October 2022 low and rallied breaking above the daily 200 MA. It has now moved to the downward channel resistance from the July 2024 high.
Consumer Disc, XLY has been consolidating above the daily 200 MA and remains in the upward channel from the December 2022 low.
The Retail sector, XRT defended the 75 support/daily 200 MA and then moved higher breaking out of the rangebound price action. Next resistance is at 79 level.
The Tech sector, XLK defended the upward channel support from the October 2022 low and rallied higher breaking out of the rangebound price action. It is now approaching the all-time highs.
Transports, IYT continues to consolidate between the daily 200 MA and the 50 MA. It remains in the upward channel from the October 2022 low.
Financials sector, XLF is consolidating at a long-term resistance line which is not far from the all-time high.
The Materials sector, XLB moved higher toward the daily 200 MA. It remains within a long-term upward channel.
Industrials, XLI broke out of the rangebound price action and made a new all-time record high. It remains in the upward channel from the March 2020 lows.
The Health sector, XLV has been consolidating near the downward channel support from the September 2024 high and is approaching the daily 50 MA.
Consumer Staples, XLP continues to consolidate above the daily 200 MA/50 MA and remains within the upward channel from the October 2023 low.
Utilities, XLU continues to consolidate and remains in the upward channel from the October 2023 low.
The Energy sector, XLE has been rangebound for over two years (shaded area) and is consolidating below the daily 50 MA.
YEAR-TO-DATE RETURN:
SPX S&P 500 +2.6%
IXIC Nasdaq +1.4%
DJIA Dow Jones +1.3%
XLI U.S. Industrials Sector: +10.3%
XLU U.S. Utilities Sector: +8.0%
XLF U.S. Financial Sector: +6.5%
XLB U.S. Materials Sector: +4.8%
XLP U.S. Consumer Staples Sector: +4.5%
XLK U.S. Technology Sector: +2.7%
SOX Semiconductor Index: +0.2%
IYT Dow Jones Transports: -1.3%
XRT U.S. Retail Industry: -1.3%
XLV U.S. Health Care Sector: -1.9%
XLE U.S. Energy Sector: -1.9%
XLY U.S. Consumer Disc Sector: -5.2%
Week of 6/9/2025:
Click link for complete Economic Calendar.
United States - CPI & PPI reports and the University of Michigan’s consumer sentiment survey.
China - consumer & producer price data, as well as foreign trade figures.
Germany - wholesale price data.
United Kingdom - labor market statistics, April GDP growth, the goods trade balance, and industrial production.
Australia - NAB business confidence and Westpac consumer confidence surveys.
Inflation - Mexico, Brazil, Russia, and India.
Market Analysis
Keep reading with a 7-day free trial
Subscribe to PalmaFutures Newsletter to keep reading this post and get 7 days of free access to the full post archives.