


Sunday Post - Recap & Week Ahead 6/1/2025
Stock Market Analysis and Insights, Charts and Levels

PLEASE SEE INTRO POST AND READ DISCLAIMER & INTELLECTUAL PROPERTY SECTIONS
NOTE: Free subscribers will continue to receive the weekly Sunday Post, but it will not include the final section with the chart, key levels, and detailed analysis for the upcoming week. Upgrade to a paid subscription to unlock the full Sunday Post and gain exclusive access to subscriber-only daily game plans.
US equities advanced during the holiday-shortened week, buoyed by gains in large-cap technology stocks and resilient economic data. The S&P 500 rose 1.9%, the Nasdaq gained 2.0%, and the Dow Jones added 1.6%. Small-cap stocks underperformed, with the Russell 2000 edging up 0.5%. Sector performance was mixed. Technology and real estate led the gains, while energy and utilities lagged. Investor sentiment turned more cautious. The AAII Bullish Sentiment Survey declined to 32.9% from 37.7% the previous week, falling below its historical average of 37.5%. The CNN Fear & Greed Index hovered in "Greed" territory at 64, indicating a moderate level of investor optimism.
Bond yields declined amid investor concerns over fiscal policy and inflation. The 10-year Treasury yield decreased to 4.41%, while the 30-year yield fell to 4.84%. In commodities, Gold prices remained relatively stable, closing the week at $3,289.43 per ounce. Crude oil prices declined, with WTI futures settling at $60.79 per barrel, amid concerns over increased OPEC+ supply. Bitcoin (BTC) has dropped 8% from its all-time high level, ending the week at $103,989, as investors showed continued interest in digital assets amid market volatility.
Overall, the week was characterized by gains in major equity indices, driven by strength in technology and real estate sectors, amid declining bond yields and cautious investor sentiment.
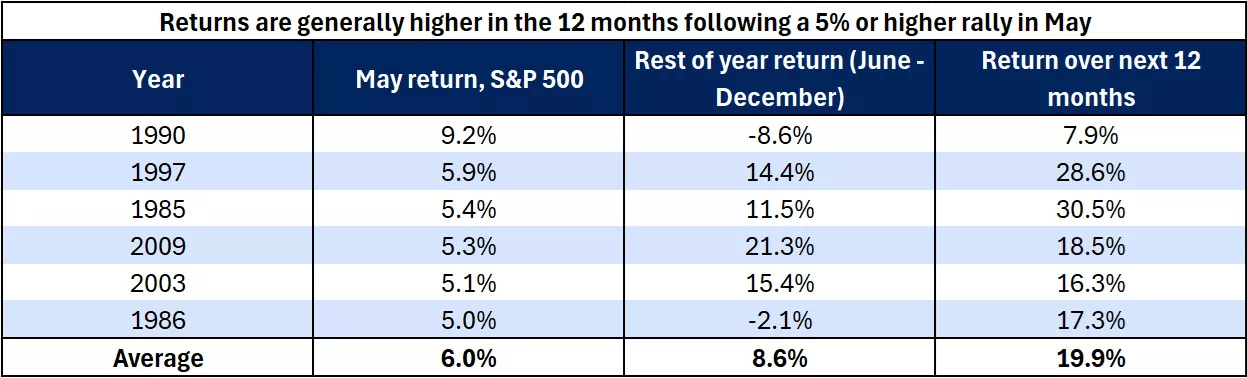
The S&P 500 closed up 6.2% in May, pushing the year-to-date return back into positive territory. Historically, since 1980, there have been six instances where the S&P 500 gained 5% or more in May. In all six cases, the index posted gains over the following 12 months. See the table below. On average, the return from June through December in those years was approximately 8.6%, while the average 12-month return following such a May rally was nearly 20%.
Source: Morningstar Direct
The ES market reclaimed both the key support level at 5845 and the daily 200 MA, making an initial attempt to break above the Balance area. However, the breakout attempt failed, and the market subsequently retested the support zone, which is holding for now. Price action remains within the upward channel originating from the April lows and is currently in a wide-ranging, multi-day Balance phase. See the daily chart below.

As usual, I will do a brief recap of this week´s market action, followed by an analysis of the general markets and the various sectors, and conclude with an outlook for the upcoming week.
Recap:
The ES market began the week with a sharp rally, reclaiming both the 5845 level and the weekly Pivot—key milestones for the Bullish scenario outlined in the prior Sunday Post analysis. By Wednesday, price reached the top of the Balance area and broke above it, hitting all of the upside targets for the week. However, the breakout failed as the Sellers stepped in, triggering a selloff that brought the market back inside the Balance area, down to the daily 200 MA. The market then consolidated, and on Friday broke below the 200 MA, moving toward the key support zone at 5845. A swift rebound followed, with the market reclaiming the 200 MA and closing back above it. Consolidation continues, and the ES market is now in a 14-Day Balance phase.
General Markets and Sectors:
Check out the updated Charts Page which goes with this section.
The S&P 500 rallied moving above the 5870 resistance (now support) and then consolidated. Next resistance is at 6009 and support is at the daily 200 MA (5762 support level).
The NDX/Nasdaq moved higher to the 21625 resistance which was rejected, followed by a selloff where the 21171-support held. Some consolidation is taking place inside the upward channel from the December 2022/January 2023 lows.
The Dow Jones consolidated between the daily 200 MA, which coincides with the downtrend line from the all-time high, and the 41915 support. A break above the 42700 resistance can take this market higher.
Small Caps (IWM) consolidated at the downward channel resistance from the November 2024 high.
The FFTY index continues to grind higher and remains inside the upward channel from the October 2023 low.
The $VIX consolidated below the 20 level and remains technically weak which reflects a generally Bullish environment for equities.
Crude Oil consolidated below the daily 50 MA. If the 50 MA is reclaimed, next resistances are at the downward channel resistance from the March 2022 high and the $67 level. Support is at $58.
Gold consolidated above the 3288 support. Next resistance is at 3424 and next support is at 3210/daily 50 MA.
The US 10-Year sold off to the 4.40% support. It remains in the downward channel from the October 2023 high.
The USDJPY got rejected at the 145 resistance and the daily 50 MA. Next support is at 141.75. It remains Bearish since the July 2024 highs.
Bitcoin sold off and moved back inside the upward channel from the October 2023 low. Resistance is at 106175 and support is 101275.
Semis, SOX has been consolidating around the daily 200 MA and the upward channel support from the October 2022 low. However, it still remains in the downward channel from the July 2024 high.
Consumer Disc, XLY has been consolidating above the daily 200 MA and remains in the upward channel from the December 2022 low.
The Retail sector, XRT has been consolidating around the daily 200 MA and the 75 support, which is close to the backtest of the downward channel from the December 2024 high.
The Tech sector, XLK has been consolidating around the upward channel support from the October 2022 low.
Transports, IYT is consolidating between the daily 200 MA and the 50 MA. It remains in the upward channel from the October 2022 low.
Financials sector, XLF is consolidating at a long-term resistance line which is not far from the all-time high.
The Materials sector, XLB has been consolidating at the backtest of the downward channel from the October 2024 high. However, it remains within a long-term upward channel.
Industrials, XLI is consolidating around the all-time record highs. It remains in the upward channel from the March 2020 lows.
The Health sector, XLV has been consolidating near the downward channel support from the September 2024 high.
Consumer Staples, XLP continues to consolidate above the daily 200 MA/50 MA and remains within the upward channel from the October 2023 low.
Utilities, XLU consolidated and remains in the upward channel from the October 2023 low.
The Energy sector, XLE has been rangebound for over two years (shaded area) and is consolidating below the daily 50 MA.
YEAR-TO-DATE RETURN:
SPX S&P 500 +0.5%
DJIA Dow Jones -0.6%
IXIC Nasdaq -1.0%
XLU U.S. Utilities Sector: +9.0%
XLI U.S. Industrials Sector: +8.7%
XLP U.S. Consumer Staples Sector: +5.9%
XLF U.S. Financial Sector: +5.8%
XLB U.S. Materials Sector: +3.1%
XLK U.S. Technology Sector: -0.5%
IYT Dow Jones Transports: -2.9%
XLV U.S. Health Care Sector: -3.2%
XLE U.S. Energy Sector: -4.1%
XLY U.S. Consumer Disc Sector: -4.4%
XRT U.S. Retail Industry: -4.4%
SOX Semiconductor Index: -5.3%
Week of 6/2/2025:
Click link for complete Economic Calendar.
United States - labor market report, ISM Manufacturing & Services PMIs, JOLTS job openings, factory orders, and foreign trade data. Also, speeches by Fed officials.
Interest rate announcements - European Central Bank, Bank of Canada, and Reserve Bank of India.
Inflation readings - the Euro Area, South Korea, Switzerland, and Turkey.
GDP growth data - Switzerland, South Africa, and Australia.
April foreign trade figures - Australia, Canada, Brazil, Germany, and France.
Global PMI releases & manufacturing data - South Korea, Russia, Italy, Spain, Canada, and China.
Services data - Spain, Italy, Brazil, and China.
Market Analysis
Keep reading with a 7-day free trial
Subscribe to PalmaFutures Newsletter to keep reading this post and get 7 days of free access to the full post archives.