


Sunday Post - Recap & Week Ahead 4/6/2025

NOTE: Free subscribers will continue to receive the weekly Sunday Post, but it will not include the final section with the chart, key levels, and detailed analysis for the upcoming week. Upgrade to a paid subscription to unlock the full Sunday Post and gain exclusive access to subscriber-only daily game plans.
This week marked a dramatic shift in market sentiment as US stock indexes experienced their steepest weekly declines since March 2020. The S&P 500 faced a severe correction, finishing down by more than 9% overall for the week. More strikingly, the index closed approximately 17% below the record high it had reached just six weeks earlier. The Nasdaq also suffered, with the index dropping by around 10% over the week, while the Dow Jones experienced a relatively milder decline of roughly 8%.
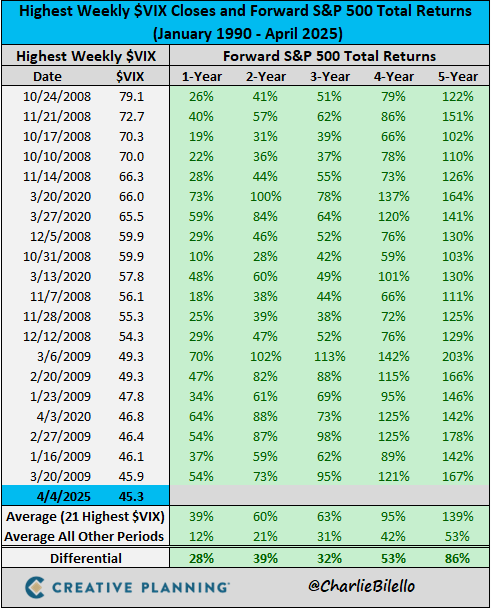
Meanwhile, the $VIX surged to 45.3 by the end of the week — among the highest weekly closes in history. This level typically reflects extreme fear or uncertainty in the market and is often associated with capitulation-style selling. Historically, however, such spikes in the $VIX have been reliable contrarian indicators, signaling major market bottoms or pivotal turning points. In fact, following past instances where the $VIX closed above 45 on a weekly basis, stocks have rallied 100% of the time over the subsequent 1, 2, 3, 4, and 5 years, with returns far exceeding historical averages as shown in the table below.
h/t: Charlie Bilello
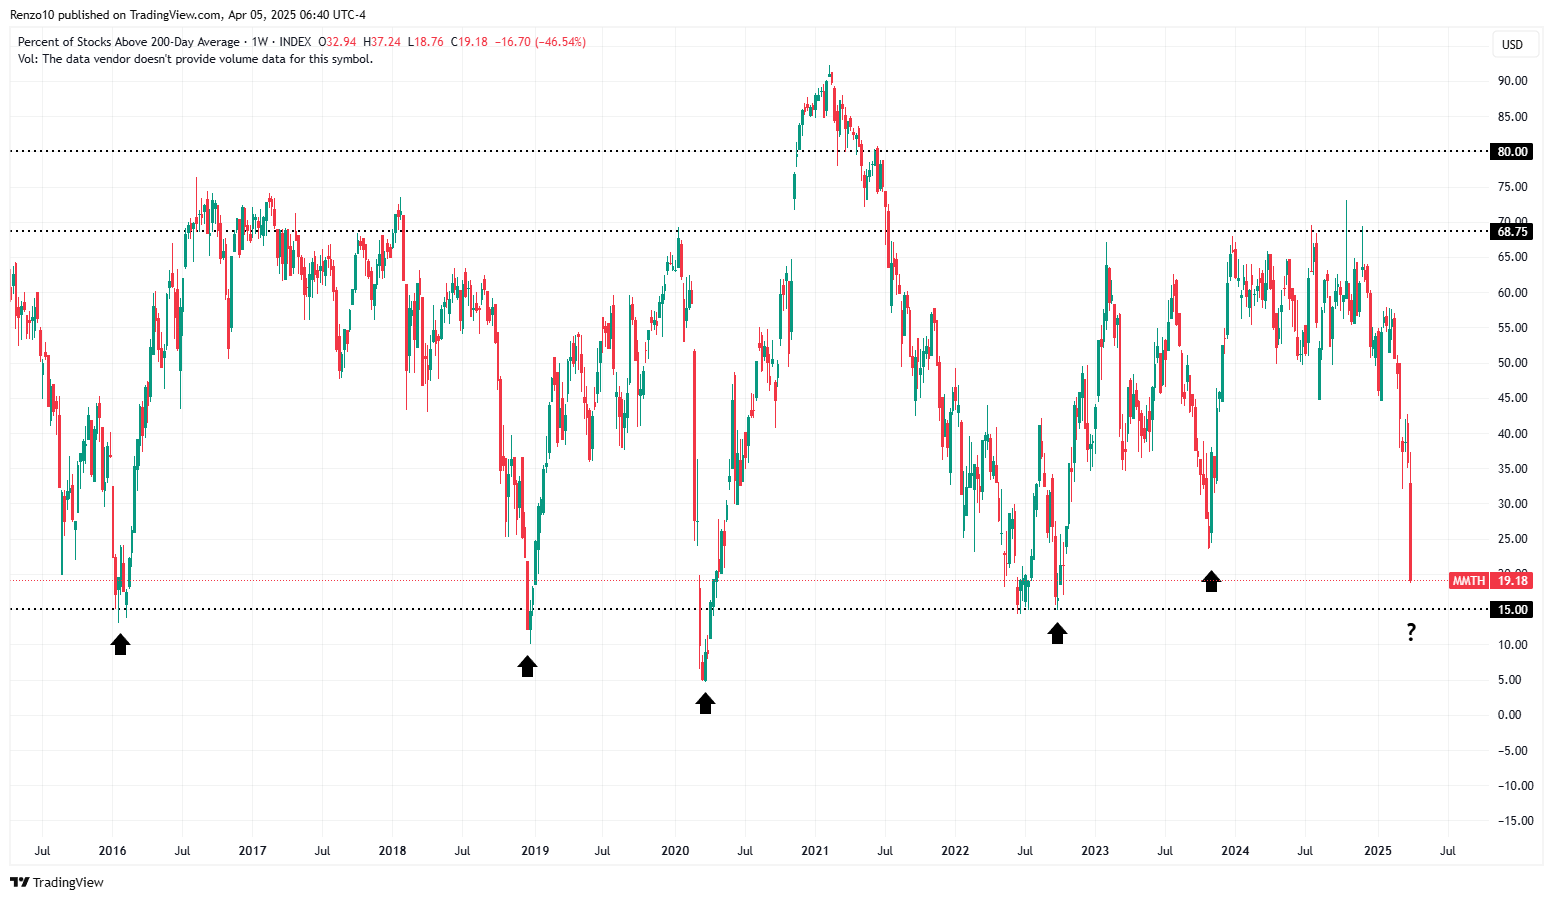
Moreover, with respect to market breadth, the percentage of stocks trading above their daily 200 MA is nearing zones that have typically aligned with major market bottoms. The chart below highlights these inflection points, with black arrows marking key turning points over the past decade — including January/February 2016, December 2018, March 2020, October 2022, and October 2023. This indicator has been one of the more reliable signals for long-term investing in my experience — particularly when focusing on fundamentally sound, profitable companies. That said, I want to be clear; this is not a call for a bottom. I’m not in the business of predicting tops or bottoms. Rather, I’m highlighting what has consistently worked for me from a long-term investment perspective.
Turning to the ES market, the initial rally to the downward channel resistance from the February high was sharply rejected, resulting in a massive selloff. Based on this week's price action, I’ve adjusted and widened the downward channel to reflect new market-generated information. See the daily chart below. Additionally, the daily 50 MA is on the verge of crossing below the 200 MA, a pattern known as a “death cross”, which tends to reinforce Bearish momentum. Still, with sentiment this negative and positioning likely stretched, I wouldn’t be surprised to see a short-term relief rally, even if broader macro and technical risks remain elevated.

As usual, I will do a brief recap of this week´s market action, followed by an analysis of the general markets and the various sectors, and conclude with an outlook for the upcoming week.
Recap:
The ES market began the week with a gap down at the Sunday evening open but quickly reversed higher over the following sessions. As outlined in the early daily plans, the market was facing multiple layers of overhead resistance, which needed to be cleared for any sustained upside continuation. By Wednesday afternoon, the ES market had reached the bottom of the prior 4-Day Balance — one of the key resistance zones highlighted earlier. Then, during after-hours trading, the market surged, reaching the final upside target for the week as identified in the prior Sunday Post analysis, topping at 5773.25. However, this strength was short-lived. A sharp 200-point sell-off followed, marking a dramatic reversal. The next day, the market gapped down, this time plunging directly toward the final downside target from the weekly plan. It was a striking display of volatility — the market moved between the weekly extreme targets in a matter of hours. On Friday, losses deepened further, with multiple support levels breaking down. The market remains in a clear Bearish Imbalance phase, continuing its revaluation process amid elevated volatility and uncertainty.
General Markets and Sectors:
Check out the updated Charts Page which goes with this section.
The S&P 500 initially rallied to the downward channel resistance from the February high and then sold off sharply breaking multiple support levels. The market is approaching the April 2024 lows and the upward channel support from the March 2020 low, around the 4928-support level.
The NDX/Nasdaq initially rallied to the downward channel resistance from the February high and then sold off breaking multiple support levels as well. It is now at the 17350-support level (August 2024 low) and approaching the April 2024 low, which is a strong support area.
The Dow Jones initially rallied to the downward channel resistance and the daily 200 MA, which was rejected, followed by a massive selloff to the upward channel support from the March 2020 low (38351 support level). Also, it is approaching the April 2024 low around the 37715-support level.
Small Caps (IWM) initially got rejected at the 200 level (now resistance) and then sold off sharply to the downward channel support from the November 2024 high, near the 172.50 support level.
The FFTY index broke below the upward channel support from the October 2023 low and approached the key 24-support level. Let´s see if this area holds.
The $VIX spiked higher, moving above the 36 level, which is in the extreme volatility territory.
Crude Oil got rejected at the daily 200 MA and then sold off sharply, breaking below the long-term uptrend line and the $67 support area (now resistance). It has moved back inside the downward channel from the March 2022 high and next support is at $58.
Gold broke above the upward channel resistance from the February 2024 low and made another new all-time record high. Then, it sold off sharply moving back inside the channel and toward the 3000 support.
The US 10-Year yield broke below the 4.21% support/daily 200 MA (now resistance) and moved lower to the 3.90% support, which was defended. It remains in a downward channel from the October 2023 high.
The USDJPY broke below the 150 - 148.50 support area (now resistance) and moved lower to the upward channel support from the January 2021 low, near the 145-support level, which were defended.
Bitcoin continues to consolidate between the 80425 support and the 87300 resistance. It remains inside the upward channel from the October 2023 low, but it is in a downtrend from its all-time high. Note the daily 50 MA about to cross below the 200 MA.
Semis, SOX broke below the April and August 2024 lows, then sold off sharply toward the downward channel support from the July 2024 high.
Consumer Disc, XLY initially rallied to the daily 200 MA which was rejected. This resulted in a massive selloff to the gradual upward channel support from the December 2022 low, closing slightly below it.
The Retail sector, XRT initially rallied to the 70.60 resistance but was rejected. This resulted in a massive selloff toward the downward channel support from the December 2024 high.
The Tech sector, XLK extended its losses to the December 2023 lows.
Transports, IYT sold off sharply and broke below the upward channel support from the October 2022 low.
Financials sector, XLF sold off sharply and broke below the daily 200 MA. It is currently near the September 2024 low.
The Materials sector, XLB broke below the upward channel support from the October 2022 low and moved lower to the downward channel support from the October 2024 high.
Industrials, XLI initially got rejected at the daily 200 MA and then sold off sharply toward the upward channel support from the March 2020 low.
The Health sector, XLV broke below a long-term uptrend line and sold off sharply toward the downward channel support from the September 2024 high.
Consumer Staples, XLP broke below the daily 200 MA/50 MA and sold off to the upward channel support from the October 2023 low.
Utilities, XLU has been rangebound since January and sold off sharply moving to the lower boundary of this range (YTD low). It has now broken below the daily 200 MA and the upward channel support from the October 2023 low.
The Energy sector, XLE has been rangebound for over two years (shaded area) and sold off sharply toward the lower boundary of this range.
YEAR-TO-DATE RETURN:
DJIA Dow Jones -9.5%
SPX S&P 500 -13.4%
IXIC Nasdaq -19.1%
XLP U.S. Consumer Staples Sector: +0.3%
XLU U.S. Utilities Sector: -0.8%
XLV U.S. Health Care Sector: -1.3%
XLB U.S. Materials Sector: -7.0%
XLE U.S. Energy Sector: -7.3%
XLF U.S. Financial Sector: -8.2%
XLI U.S. Industrials Sector: -10.2%
IYT Dow Jones Transports: -15.7%
XLY U.S. Consumer Disc Sector: -18.3%
XRT U.S. Retail Industry: -18.3%
XLK U.S. Technology Sector: -21.4%
SOX Semiconductor Index: -28.4%
Week of 4/7/2025:
Click link for complete Economic Calendar.
United States - CPI & PPI data, and NFIB Business Optimism Index. Also, FOMC minutes.
Eurozone - Retail sales.
Germany - Industrial production.
United Kingdom - monthly GDP report for February.
China - March inflation and trade data.
Reserve Bank of India - latest monetary policy decision.
Keep reading with a 7-day free trial
Subscribe to PalmaFutures Newsletter to keep reading this post and get 7 days of free access to the full post archives.