


Sunday Post - Recap & Week Ahead 7/6/2025
Stock Market Analysis & Insights, Charts and Levels

PLEASE SEE INTRO POST AND READ DISCLAIMER & INTELLECTUAL PROPERTY SECTIONS
NOTE: Free subscribers will continue to receive the weekly Sunday Post, but it will not include the final section with the chart, key levels, and detailed analysis for the upcoming week. Upgrade to a paid subscription to unlock the full Sunday Post and gain exclusive access to subscriber-only daily game plans.
The US stock market was strong this week in a holiday‐shortened session, supported by upbeat economic data, dovish Fed commentary and continued geopolitical calm. The S&P 500 and the Nasdaq added to the record levels that they set the previous week, while the Dow Jones was within 0.4% of its record high. The S&P 500 rose 1.7%, closing at 6,279.35; the Nasdaq climbed 1.6%, ending at 20,601.10; the Dow Jones gained 2.3%, finishing at 44,828.53; and the Russell 2000 jumped 3.4%, closing near 2,232.30, which is now in positive territory on a year-to-date basis. All eleven S&P 500 sectors advanced, led by Materials (+3.7%), Information Technology (+2.6%) and Financials (+2.2%). Energy also participated, rising 2.1%, while Consumer Discretionary, Industrials, Communication Services, Consumer Staples, Health Care, Real Estate and Utilities all posted gains. Market breadth continued to improve—advance/decline lines on both the NYSE and Nasdaq ticked higher—and volatility eased, with the VIX dipping to 16.38. Investor sentiment remained firmly Bullish: AAII Bullish sentiment climbed to 45.0%, and the CNN Fear & Greed Index sat at 78.
Bond yields moved higher on fading rate‑cut odds: the 10‑Year Treasury rose 1.71% for the week to close at 4.35%, and the 30‑Year Treasury ended at 4.86%. Gold inched up 0.4%, ending near $3,330.44/oz, while WTI crude oil advanced 2.2% to $66.46/barrel. Bitcoin (BTC) rallied to a weekly high of $110,557 on July 3 before closing near $107,975 on July 6. US‑listed spot Bitcoin ETFs saw continued inflows, with Fidelity’s FBTC drawing $237.1 m, BlackRock’s IBIT netting $224.5 m, and ARK 21Shares’ ARKB taking in $114.3 m.
Overall, it was a broad‐based risk‑on week: major indices all rose, every sector participated, breadth improved, volatility eased, yields ticked up modestly, gold inched higher, oil rallied and bitcoin slightly extended its advance on robust ETF flows. Investors enter the second half of 2025 optimistic, even as they watch closely for shifts in Fed policy and global trade developments.
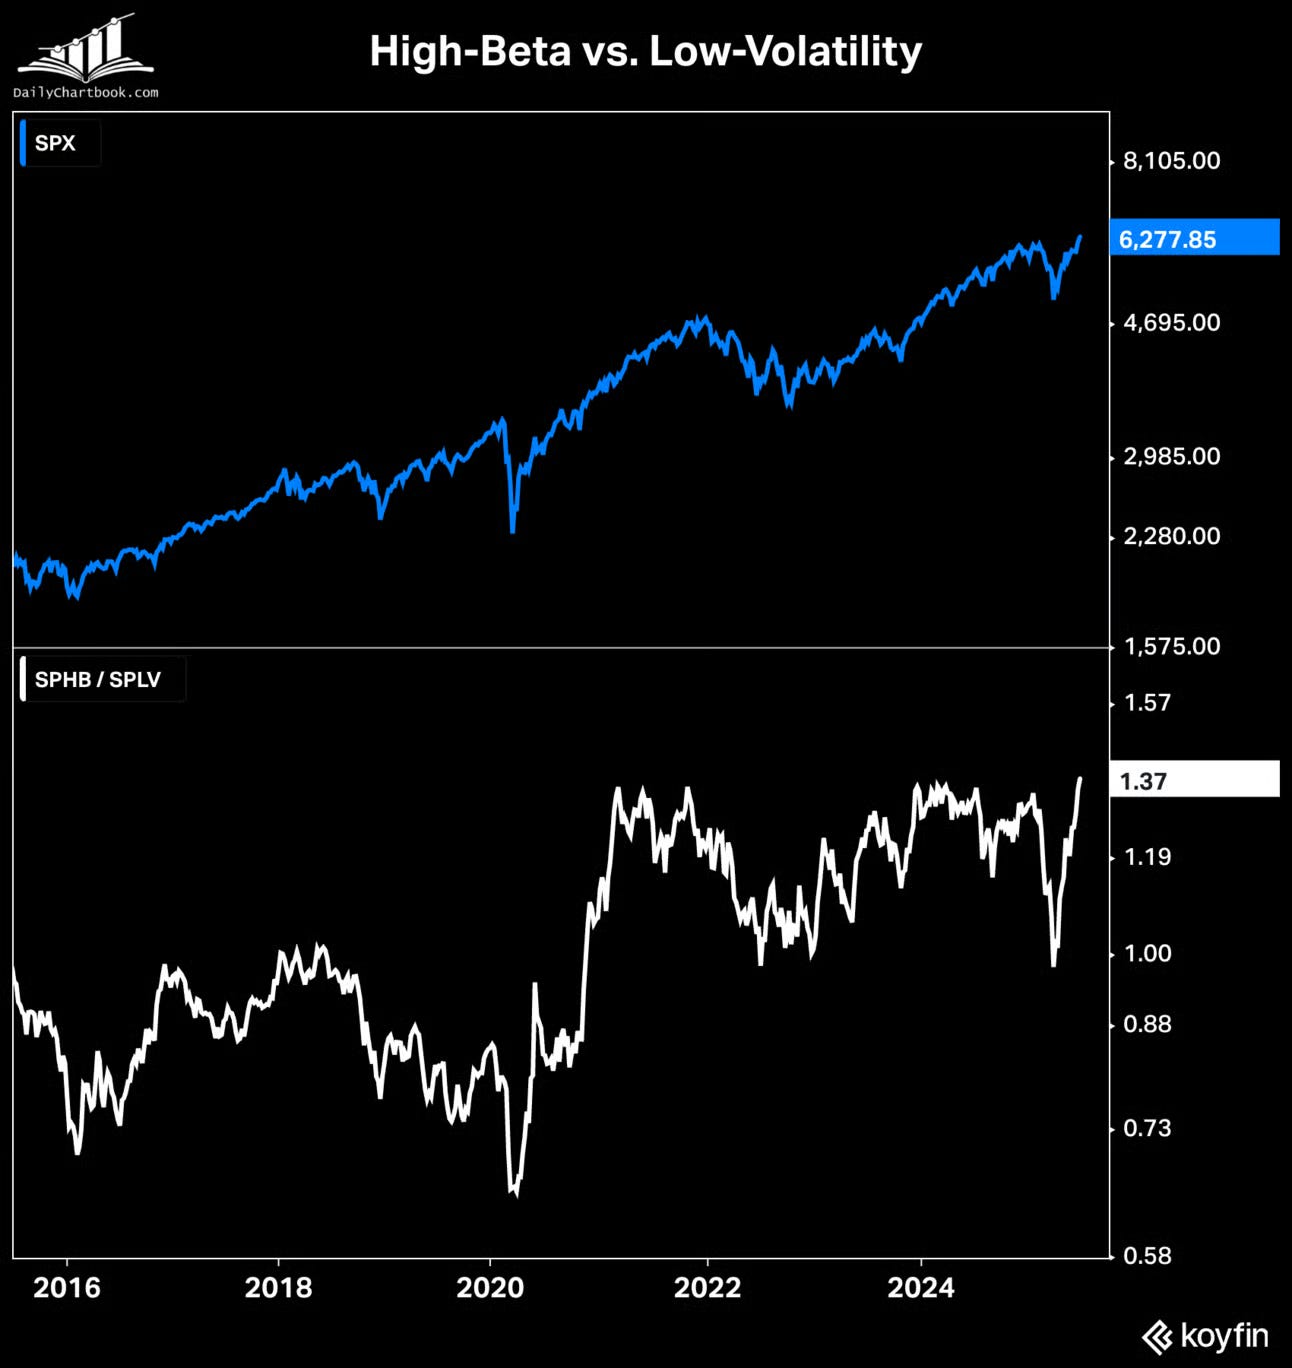
In addition, there is a notable level of confidence and optimism among active investment managers, as reflected in the NAAIM Exposure Index, which currently stands at 99.30 — its highest reading in over a year (see chart below). Meanwhile, high-beta stocks (SPHB) have reached all-time highs relative to their low-volatility counterparts (SPLV), further reinforcing the risk-on sentiment in the market (see next chart).
h/t:

The ES market also reached a new all-time record high, breaking above the key 6284 resistance level. It is now approaching overhead resistance defined by a prior upward channel, so it remains to be seen whether price can break through cleanly or face a short-term pullback. Notably, the daily 50 MA is on the verge of crossing above the 200 MA— a Bullish technical signal known as a “golden cross.” For now, the market continues to trade within the broader upward channel that began at the April lows.

As usual, I will do a brief recap of this week´s market action, followed by an analysis of the general markets and the various sectors, and conclude with an outlook for the upcoming week.
Recap:
In this holiday-shortened week, the ES market broke above the previous week’s high early on and consolidated around that level, which was consistently defended by the Buyers. As outlined in the previous Sunday Post, a decisive break above this area was critical for the Bullish scenario and the market delivered. On Wednesday, momentum picked up, and by Thursday, the ES rallied to a new all-time record high. All upside targets for the week were met, in line with the Sunday Post analysis. The ES remains in a Bullish Imbalance phase and is currently sitting at record highs.
General Markets and Sectors:
Check out the updated Charts Page which goes with this section.
The S&P 500 rallied higher and made another all-time record high. Note the daily 50 MA has crossed above the 200 MA.
The NDX/Nasdaq rallied higher and made another all-time high. It remains inside the upward channel from the December 2022/January 2023 lows.
The Dow Jones rallied higher and broke above the 44359 resistance (now support). It is now approaching the 45014 resistance, which is at the all-time high.
Small Caps (IWM) defended the daily 200 MA and then rallied higher. It is now approaching the 227 resistance.
The FFTY index moved slightly higher after some consolidation and remains inside the upward channel from the October 2023 low.
The $VIX moved slightly lower and remains technically weak which reflects a generally Bullish environment for equities.
Crude Oil moved higher but seems like it is consolidating between the daily 50 MA and 200 MA, with $67 acting as resistance.
Gold bounced off the 3288 support (also back-test of the upward channel from February 2024 low) and reclaimed the daily 50 MA. Overall, Gold has been consolidating since April.
The US 10-Year bounced off the 4.21% support and reclaimed the daily 200 MA. Resistance is at 50 MA and 4.40% level. It remains in the downward channel from the October 2023 high.
The USDJPY initially broke below the daily 50 MA and moved toward the 141.75 support. Then, rallied to the 145 resistance and closed above the 50 MA.
Bitcoin moved higher to the upward channel resistance from the October 2023 low and the 110300 resistance. A break above this area could see new all-time highs but for now it has been in consolidation mode since May.
Semis, SOX continues to climb higher and is gradually approaching the all-time highs. It remains in the upward channel from the October 2022 low.
Consumer Disc, XLY broke out of its recent consolidation range. It is now approaching the upward channel resistance from the December 2022 low.
The Retail sector, XRT defended the daily 200 MA and rallied higher breaking above the 79-resistance level (now support).
The Tech sector, XLK rallied higher after some consolidation and made another all-time record high. It remains in the upward channel from the October 2022 low.
Transports, IYT defended the daily 200 MA and rallied higher. It remains in the upward channel from the October 2022 low.
Financials sector, XLF moved higher and made an all-time record high. It remains in the upward channel from the October 2023 low.
The Materials sector, XLB broke above the daily 200 MA and moved to the February high. It remains within a long-term upward channel.
Industrials, XLI rallied to another all-time record high. It remains in the upward channel from the March 2020 lows.
The Health sector, XLV has been in a wide-ranged consolidation since April and remains in the downward channel from the September 2024 high.
Consumer Staples, XLP continues to consolidate around the daily 200 MA/50 MA (now above it) and remains within the upward channel from the October 2023 low.
Utilities, XLU continues to consolidate and remains in the upward channel from the October 2023 low.
The Energy sector, XLE is consolidating between the daily 50 MA and 200 MA. It has been rangebound for over two years (shaded area).
YEAR-TO-DATE RETURN:
SPX S&P 500 +7.5%
IXIC Nasdaq +7.1%
DJIA Dow Jones +6.3%
XLI U.S. Industrials Sector: +14.1%
SOX Semiconductor Index: +12.3%
XLK U.S. Technology Sector: +10.9%
XLF U.S. Financial Sector: +10.8%
XLB U.S. Materials Sector: +9.7%
XLU U.S. Utilities Sector: +9.6%
XLP U.S. Consumer Staples Sector: +5.8%
IYT Dow Jones Transports: +5.2%
XLE U.S. Energy Sector: +3.2%
XRT U.S. Retail Industry: +1.8%
XLV U.S. Health Care Sector: -0.7%
XLY U.S. Consumer Disc Sector: -0.9%
Week of 7/7/2025:
Click link for complete Economic Calendar.
United States - FOMC minutes.
China - consumer and producer price data.
United Kingdom - monthly GDP figures.
Germany - industrial production and trade numbers.
Canada - labor market report.
Monetary policy decisions from central banks in Australia, South Korea, Malaysia, and New Zealand.
Market Analysis
Keep reading with a 7-day free trial
Subscribe to PalmaFutures Newsletter to keep reading this post and get 7 days of free access to the full post archives.