


Sunday Post - Recap & Week Ahead 6/22/2025
Stock Market Analysis and Insights, Charts and Levels

PLEASE SEE INTRO POST AND READ DISCLAIMER & INTELLECTUAL PROPERTY SECTIONS
NOTE: Free subscribers will continue to receive the weekly Sunday Post, but it will not include the final section with the chart, key levels, and detailed analysis for the upcoming week. Upgrade to a paid subscription to unlock the full Sunday Post and gain exclusive access to subscriber-only daily game plans.
The US stock market was mixed this week, as investors weighed geopolitical concerns and rotated selectively across sectors. The S&P 500 fell 0.2%, the Nasdaq rose 0.2%, the Dow Jones was flat, and the small-cap Russell 2000 slipped 0.4%, reflecting modest softness in risk assets. Energy outperformed thanks to rising crude prices, while Utilities ended the week lower. Technology and Consumer Discretionary were both slightly down, giving back some recent gains. Market breadth weakened, with decliners outnumbering advancers on both the NYSE and Nasdaq. Volatility ticked up—the VIX climbed early in the week and settled at 20.6, highlighting elevated investor caution. The AAII Bullish sentiment reading declined to 33.2%, falling below its historical average of ~37.6%, signaling increased investor wariness. The CNN Fear & Greed Index ended the week at 55, marking a neutral sentiment stance.
Bond yields drifted lower as investors sought safety. The 10‑Year Treasury yield fell to 4.376%, while the 30‑Year yield eased to approximately 4.889%—suggesting ongoing demand for Treasuries amid global unease and stable inflation expectations. Gold declined for the week, finishing near $3,368/oz, down about 0.6%, as haven demand faded into week’s end. WTI Crude Oil gained roughly 1%, closing at $73.96/barrel, supported by geopolitical tensions and a modest pickup in demand expectations. Bitcoin (BTC) was volatile surging to a high of $108,990 on Monday and falling to $100,945 - currently near $102,545. Despite the pullback, US-listed spot Bitcoin ETFs recorded continued net inflows, led by BlackRock’s IBIT and Fidelity’s FBTC—reflecting ongoing institutional interest.
Overall, this week’s narrative was one of selective rotation: large-cap indices showed resilience, small-caps underperformed slightly, bond yields fell as safety-seeking resumed, gold moved lower, oil rose modestly, and crypto remained volatile yet supported by ETF inflows. Investor sentiment leaned cautious but not panicked, with attention firmly on global risk factors.
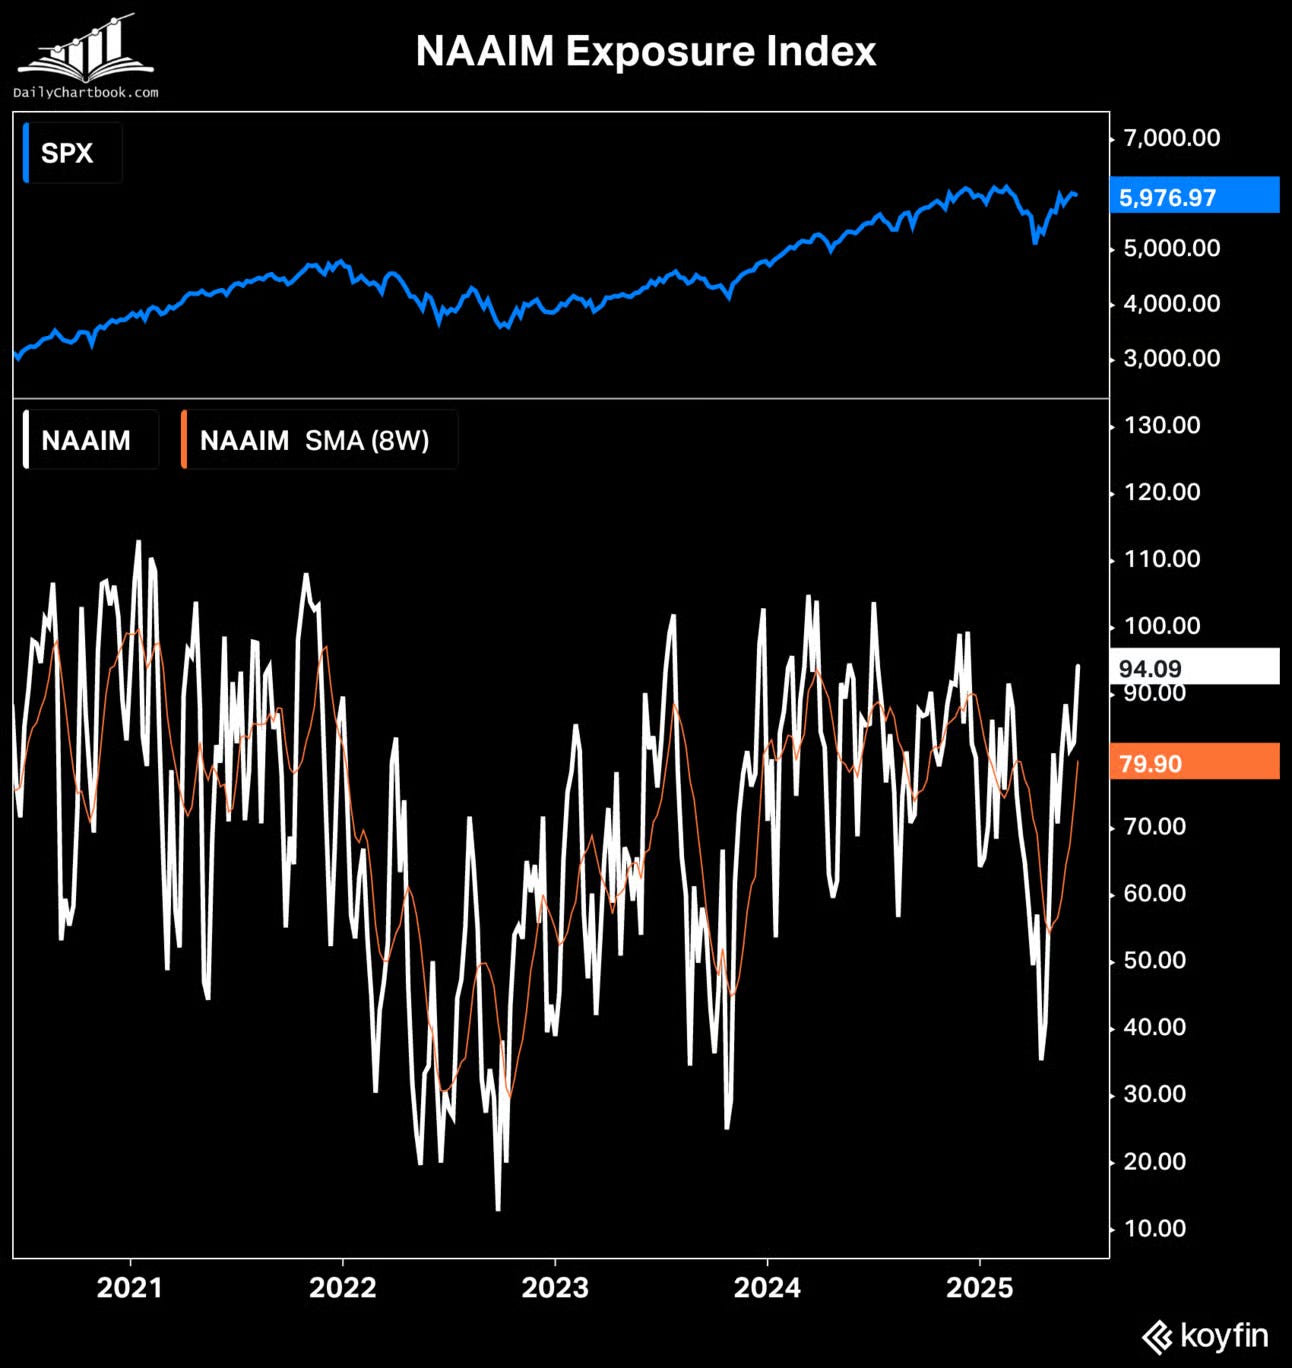
In addition, the NAAIM Exposure Index rose to its highest level since mid-December as shown in the chart below. It seems there´s a significant level of confidence and optimism among active investment managers
h/t:
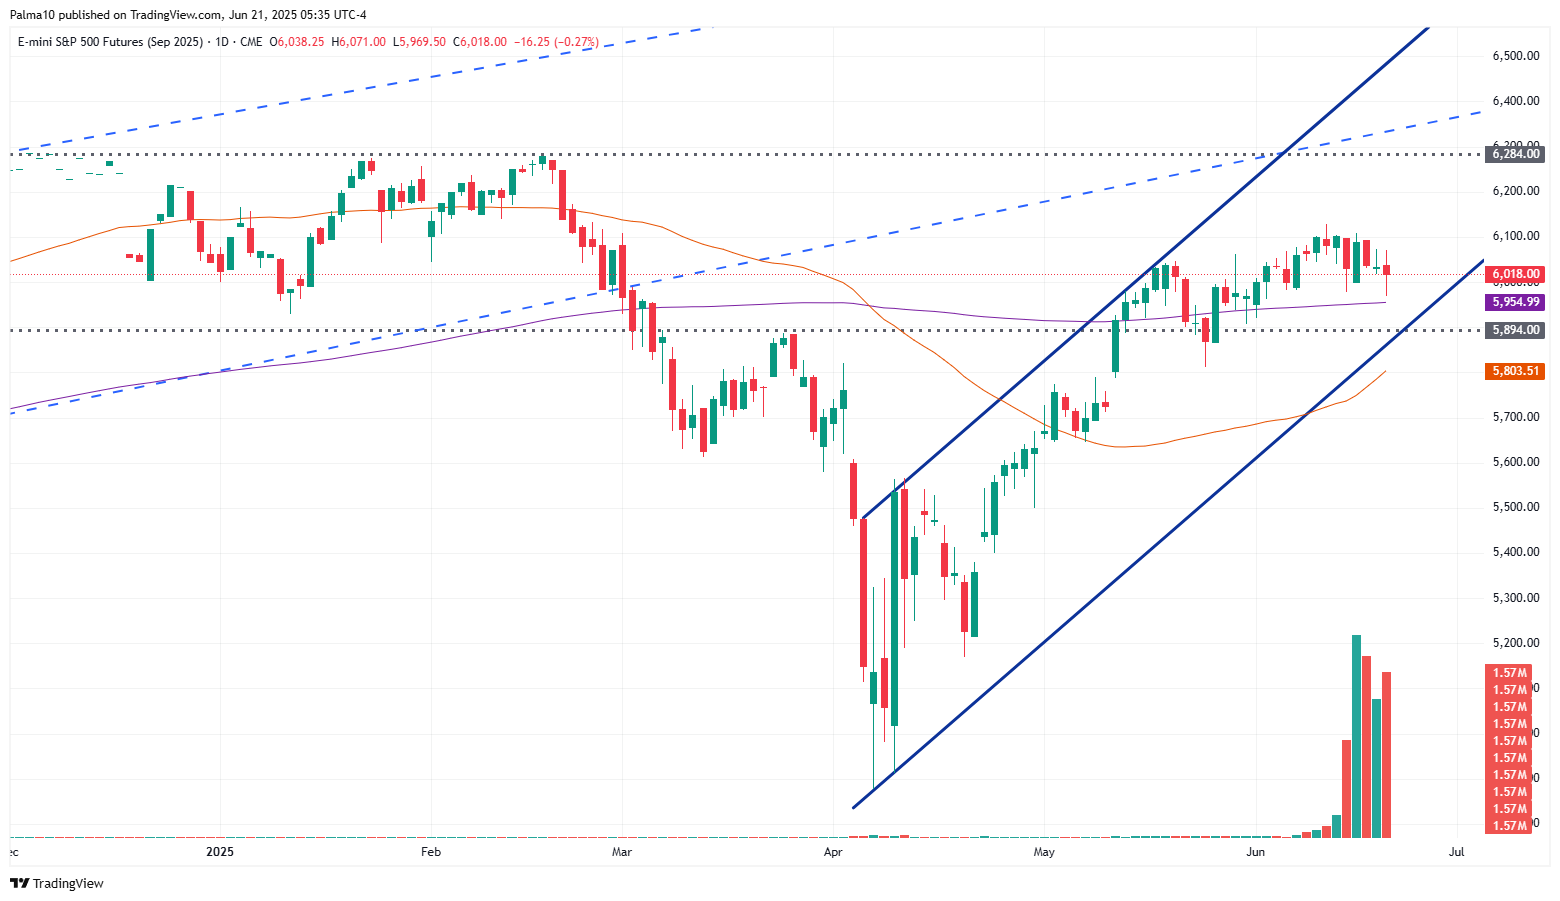
The ES market remains rangebound, with a failed breakdown attempt of the Balance area at the end of the week. Resistance is currently defined near the top of the range, while support is holding at the daily 200 MA and the key 5894 level. See daily chart below. Price action continues to trade within the broader upward channel that originated from the April lows.
As usual, I will do a brief recap of this week´s market action, followed by an analysis of the general markets and the various sectors, and conclude with an outlook for the upcoming week.
Recap:
In the shortened holiday week, the ES market began with a rally toward the top of the Balance, achieving the initial upside targets outlined in the previous Sunday Post. However, momentum faded as the Buyers lacked sufficient traction to break through the top of the Balance, and the market gradually sold off—reaching the bottom of the Balance during the Thursday OVN session. In the shortened regular session, the market broke below the Balance area. A good portion of the downside targets from the Bearish scenario was met, though the Sellers failed to reach the daily 200 MA, which was also a key target. On Friday, the market gapped higher, moving back inside the Balance area. While the market rallied early in the session, the strength faded, and the market sold off again. Despite this, price remained within the Balance area, confirming that the previous breakdown had failed. The ES is now trading within an 11-Day Balance.
General Markets and Sectors:
Check out the updated Charts Page which goes with this section.
The S&P 500 has been consolidating around the 6009 level. Next resistance is at 6090 and next support is at 5870.
The NDX/Nasdaq consolidated above the 21625 support. Resistance is at 22100 and next support is at 21171. It remains inside the upward channel from the December 2022/January 2023 lows.
The Dow Jones consolidated at the downtrend line from the all-time high, just below the daily 200 MA. Resistance is at 42700 and next support is at 41915.
Small Caps (IWM) consolidated below the 212 resistance after being rejected at the daily 200 MA. Could back-test the downward channel from the November 2024 high, which is near the 50 MA.
The FFTY index continues to be in consolidation and remains inside the upward channel from the October 2023 low.
The $VIX remains above the key 20 level and has technically strengthened which reflects a generally Bearish environment for equities if this continues.
Crude Oil defended the daily 200 MA and moved higher breaking the $73 resistance level (now support). Next resistance is at $77.
Gold got rejected at the 3424 resistance and sold off toward the daily 50 MA. Below here, next support is at 3288. Overall, Gold has been consolidating since April.
The US 10-Year has been consolidating around the 4.40% level and the daily 50 MA. Next resistance is at 4.57% and next support is at the 200 MA. It remains in the downward channel from the October 2023 high.
The USDJPY moved higher and broke above the 145 resistance (now support) after defending the daily 50 MA.
Bitcoin initially rallied to the upward channel resistance from the October 2023 low and got rejected resulting in a selloff. It is now consolidating between the 106175 resistance and the 101275 support.
Semis, SOX is consolidating above the downward channel from the July 2024 high. However, it remains in the upward channel from the October 2022 low.
Consumer Disc, XLY has been consolidating above the daily 200 MA and remains in the upward channel from the December 2022 low.
The Retail sector, XRT is consolidating between the 79-resistance level and the 75 support/daily 200 MA.
The Tech sector, XLK is consolidating around the all-time record highs. It remains in the upward channel from the October 2022 low.
Transports, IYT continues to consolidate between the daily 200 MA and the 50 MA. It remains in the upward channel from the October 2022 low.
Financials sector, XLF has been consolidating since early May, trading between the long-term resistance line and the daily 50 MA.
The Materials sector, XLB has grinded lower after being rejected at the daily 200 MA. It remains within a long-term upward channel.
Industrials, XLI is consolidating after making a new all-time record high last week. It remains in the upward channel from the March 2020 lows.
The Health sector, XLV sold off and broke back below the daily 50 MA. It has been in a wide-ranged consolidation since April and remains in the downward channel from the September 2024 high.
Consumer Staples, XLP continues to consolidate around the daily 200 MA/50 MA (now below it) and remains within the upward channel from the October 2023 low.
Utilities, XLU continues to consolidate and remains in the upward channel from the October 2023 low.
The Energy sector, XLE has been rangebound for over two years (shaded area) and has now moved above the daily 200 MA.
YEAR-TO-DATE RETURN:
SPX S&P 500 +1.5%
IXIC Nasdaq +0.7%
DJIA Dow Jones -0.8%
XLI U.S. Industrials Sector: +8.4%
XLU U.S. Utilities Sector: +7.5%
XLE U.S. Energy Sector: +4.7%
XLF U.S. Financial Sector: +4.6%
SOX Semiconductor Index: +3.7%
XLP U.S. Consumer Staples Sector: +3.6%
XLK U.S. Technology Sector: +3.6%
XLB U.S. Materials Sector: +3.2%
XRT U.S. Retail Industry: -3.0%
IYT Dow Jones Transports: -3.1%
XLV U.S. Health Care Sector: -3.2%
XLY U.S. Consumer Disc Sector: -5.8%
Week of 6/23/2025:
Click link for complete Economic Calendar.
United States - the PCE report, durable goods orders, and the goods trade balance. Attention will also turn to Fed Chair Jerome Powell’s testimony before Congress.
Flash PMIs - the US, Eurozone, Japan, and India.
Market Analysis
Keep reading with a 7-day free trial
Subscribe to PalmaFutures Newsletter to keep reading this post and get 7 days of free access to the full post archives.