


Sunday Post - Recap & Week Ahead 6/15/2025
Stock Market Analysis and Insights, Charts and Levels

PLEASE SEE INTRO POST AND READ DISCLAIMER & INTELLECTUAL PROPERTY SECTIONS
NOTE: Free subscribers will continue to receive the weekly Sunday Post, but it will not include the final section with the chart, key levels, and detailed analysis for the upcoming week. Upgrade to a paid subscription to unlock the full Sunday Post and gain exclusive access to subscriber-only daily game plans.
The US stock market declined across the board for the week, pressured by escalating geopolitical tensions and profit‑taking after recent highs. The S&P 500 slipped 0.4%, the Nasdaq lost 0.6%, the Dow Jones fell 1.3%, and the small‑cap Russell 2000 dropped 1.5%, marking a broad‑based pullback in risk assets. Defensive sectors such as Energy and Utilities outperformed amid the risk‑off tone, while Technology and Consumer Discretionary lagged. Market breadth softened, with decliners outpacing advancers on both the NYSE and Nasdaq. Volatility rose sharply—the VIX climbed to 22 early Friday and closed at 20.8, reflecting elevated investor caution. The AAII Bullish sentiment reading increased to 36.67%, just under its long‑term average of ~37.6%, signaling mild cautious optimism. The CNN Fear & Greed Index remained in “Greed” territory, hovering around 60.
Bond yields slipped as investors fled to safety. The 10‑Year Treasury yield fell from a Monday high of 4.52% to close the week at 4.41%, while the 30‑Year settled around 4.90%—a sign of waning inflation fears and soaring geopolitical unease. Bitcoin (BTC) dropped slightly closing at $106,118 and currently trading around $105,466. US-listed spot Bitcoin ETFs saw net inflows of approximately $1.37 billion for the week, led by BlackRock’s IBIT and followed by smaller contributions from Fidelity’s FBTC and others—indicating strong institutional interest.
Overall, this week’s narrative was one of defensive rotation: equities pulled back amid rising geopolitical and volatility concerns, while bond yields and safe‑haven flows suggested heightened investor caution. Crypto showed resilience, buoyed by robust ETF inflows despite a modest price dip. The tone was notably more cautious than optimistic, with markets digesting risk in multiple asset classes.
With respect to market sentiment, let’s review the following three charts:
(h/t:
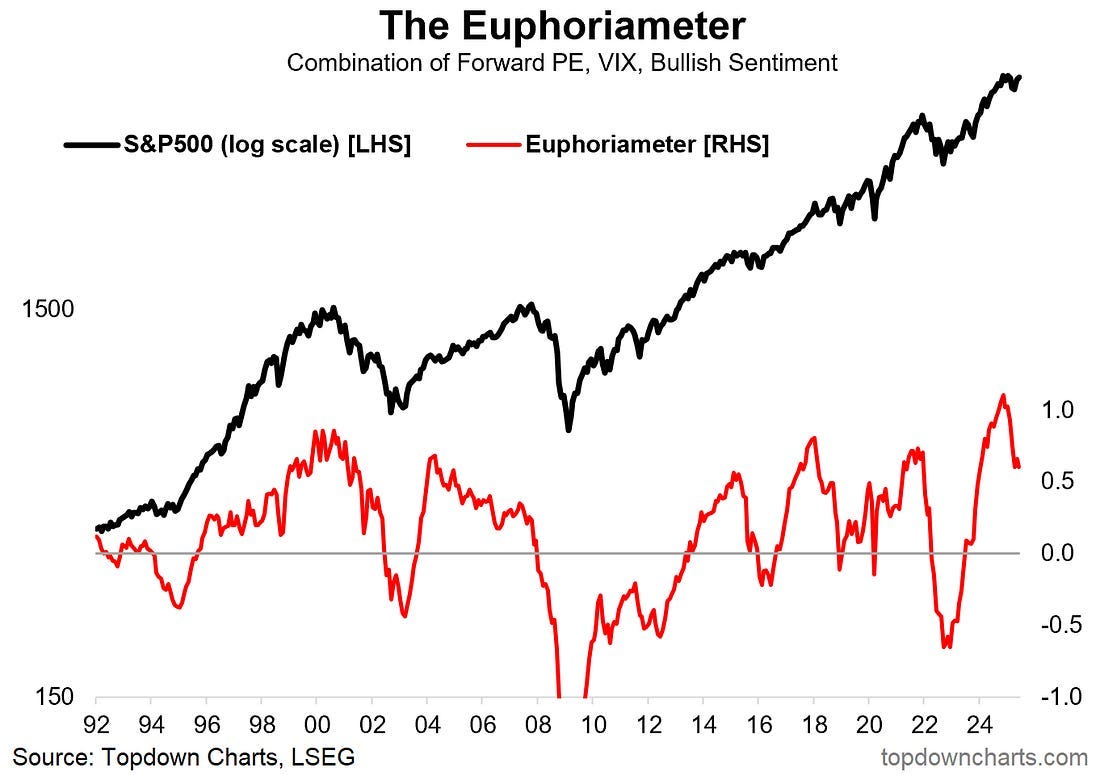
)The Euphoriameter—which blends forward P/E ratios, a smoothed and inverted VIX, and smoothed bullish sentiment surveys—remains elevated. Although it has partially pulled back from record highs, it still signals above-average optimism. See chart below.
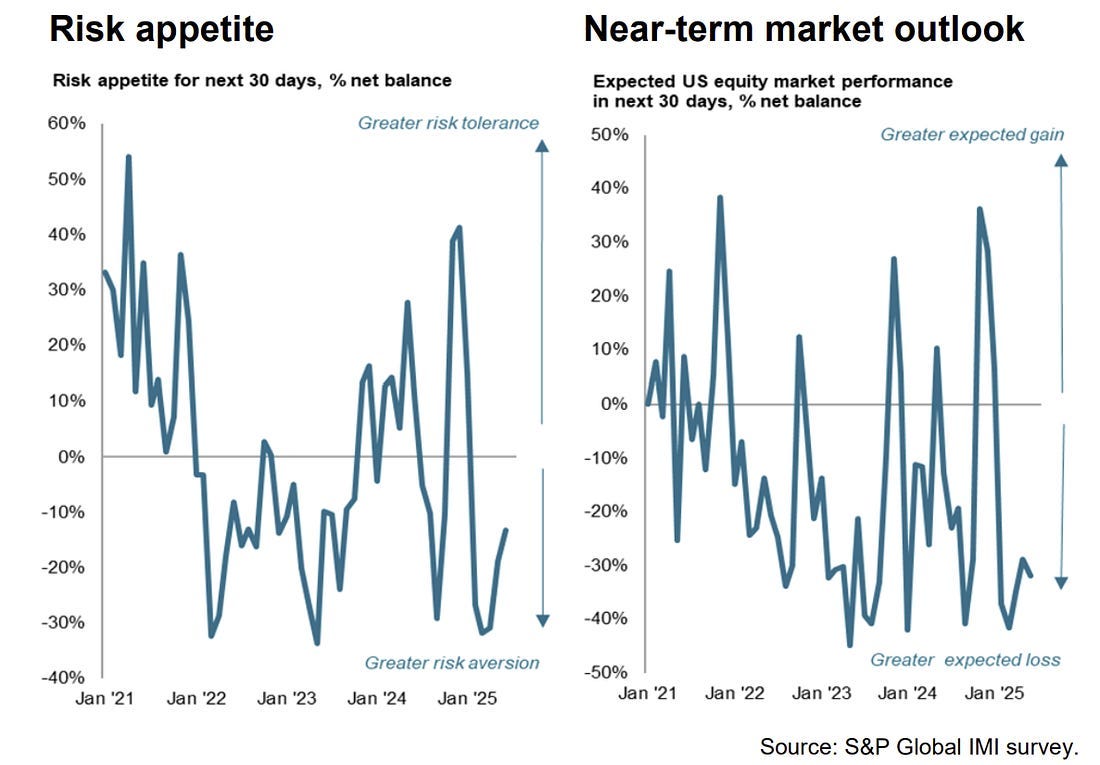
Institutional risk appetite has begun to recover, but overall positioning among investment managers remains relatively cautious. Concerns around valuations, geopolitics, and policy continue to weigh on sentiment. See chart below.

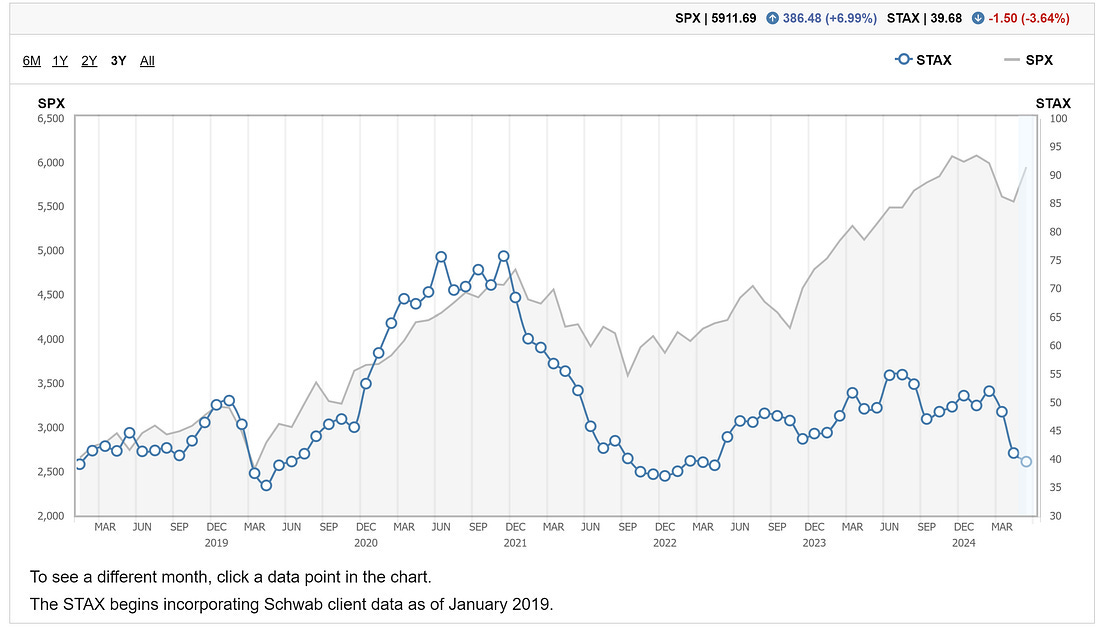
Retail sentiment, as measured by the Schwab Trading Activity Index, remains subdued. Schwab clients appear to be taking profits on prior dip-buying activity, using the recent rebound in stocks as an opportunity to reduce exposure. See chart below.


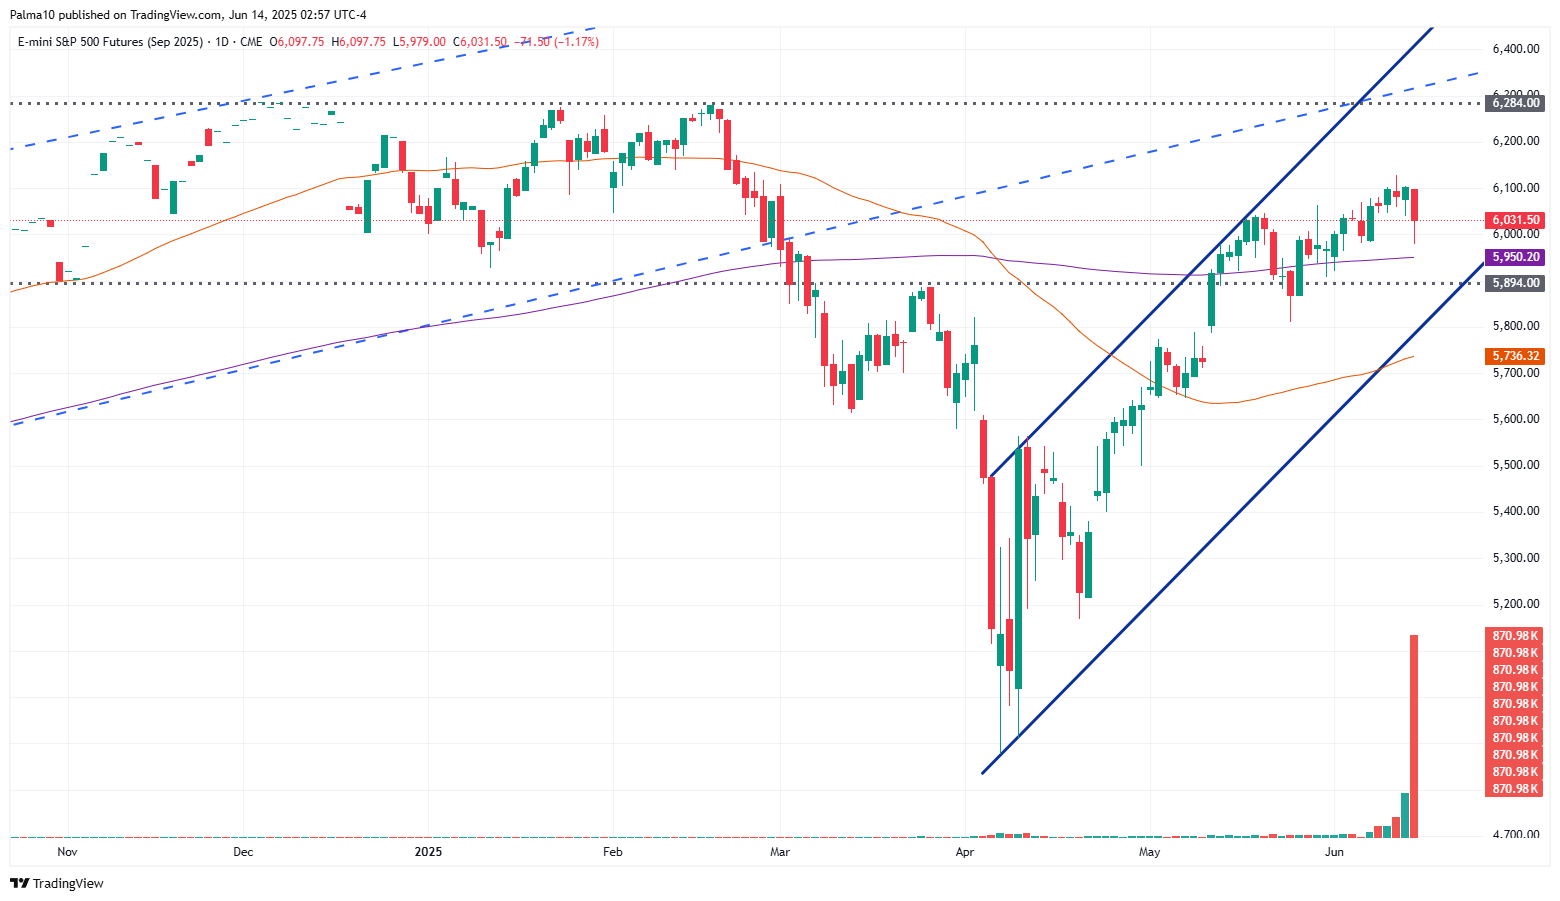
The ES market (September contract – ESU2025) started the week with a gradual grind higher but sold off sharply into the end of the week. The breakout from the prior multi-day Balance appears to have failed, and the market has now transitioned into a new Balance phase. Resistance is currently defined near the top of this new Balance area, while support lies at the daily 200 MA and the key 5894 level. See daily chart below. Despite the recent weakness, price action remains within the broader upward channel that originated from the April lows.
As usual, I will do a brief recap of this week´s market action, followed by an analysis of the general markets and the various sectors, and conclude with an outlook for the upcoming week.
Recap:
The top of the prior 18-Day Balance was defended early in the week—an important condition for the Bullish scenario outlined in previous Sunday Post. The ES market ground higher through the first half of the week, reaching several upside targets, before starting to pull back late Wednesday afternoon. As previously noted in the Newsletter, Bearish divergences from the technical indicators had developed across multiple timeframes. After a failed bounce attempt on Thursday, the market sold off sharply during the Thursday OVN session, hitting the first three downside targets identified in last Sunday’s analysis. On Friday, the market attempted to rebound, but the effort failed, resulting in a red day. The market is now in a 7-Day Balance—more on this in the Market Analysis section below.
General Markets and Sectors:
Check out the updated Charts Page which goes with this section.
The S&P 500 broke above the 6009-resistance level early on but then sold off moving back below this area. Next support is at 5870.
The NDX/Nasdaq moved higher toward the 22100 resistance, which is close to the all-time high, but then sold off to the 21625 support on Friday. Market remains inside the upward channel from the December 2022/January 2023 lows.
The Dow Jones moved higher toward the 43276 resistance but lacked traction and sold off sharply on Friday. As a result, it has broken back below 42700 support (now resistance), the daily 200 MA, and the downtrend line from the all-time high. Next support is at 41915.
Small Caps (IWM) got rejected at the daily 200 MA and sold off moving back below the 212 support (now resistance). Could back-test the downward channel from the November 2024 high.
The FFTY index is now in consolidation and remains inside the upward channel from the October 2023 low.
The $VIX spiked higher moving above the key 20 level and has technically strengthened which reflects a generally Bearish environment for equities if this continues.
Crude Oil moved higher after breaking the downward channel resistance from the March 2022 high. On Friday, it spiked higher to the $77 resistance which was rejected and closed right at the $73 level. Supports are at the daily 200 MA and $67 level.
Gold defended the 3288 support and then rallied to the 3424 resistance. A decisive break above this zone will take it to the all-time record high.
The US 10-Year sold off breaking below the 4.40% support and the daily 50 MA. However, both of these areas were reclaimed on Friday. It remains in the downward channel from the October 2023 high.
The USDJPY has been consolidating between the 145 resistance and the 141.75 support. It remains Bearish since the July 2024 highs.
Bitcoin initially rallied and broke above the upward channel from the October 2023 low. However, it sold off moving back inside the channel and breaking the 106175 support (now resistance). It has found support at the daily 50 MA and below here is the 101275 support.
Semis, SOX broke above the downward channel resistance from the July 2024 high and then sold off to back-test this channel. It remains in the upward channel from the October 2022 low.
Consumer Disc, XLY has been consolidating above the daily 200 MA and remains in the upward channel from the December 2022 low.
The Retail sector, XRT got rejected at the 79-resistance level and sold off sharply to the 75 support/daily 200 MA.
The Tech sector, XLK grinded higher and moved right to the all-time record high, which was rejected.
Transports, IYT continues to consolidate between the daily 200 MA and the 50 MA. It remains in the upward channel from the October 2022 low.
Financials sector, XLF got rejected at a long-term resistance line and sold off toward the daily 50 MA. It has been consolidating since early May.
The Materials sector, XLB consolidated below the daily 200 MA. It remains within a long-term upward channel.
Industrials, XLI made a new all-time record high and then pulled back. It remains in the upward channel from the March 2020 lows.
The Health sector, XLV rallied higher and reclaimed the daily 50 MA. It remains in the downward channel from the September 2024 high.
Consumer Staples, XLP continues to consolidate around the daily 200 MA/50 MA and remains within the upward channel from the October 2023 low.
Utilities, XLU continues to consolidate and remains in the upward channel from the October 2023 low.
The Energy sector, XLE has been rangebound for over two years (shaded area) and rallied from the daily 50 MA to the 200 MA.
YEAR-TO-DATE RETURN:
SPX S&P 500 +2.2%
IXIC Nasdaq +0.8%
DJIA Dow Jones +0.0%
XLI U.S. Industrials Sector: +8.6%
XLU U.S. Utilities Sector: +8.3%
XLB U.S. Materials Sector: +4.3%
XLF U.S. Financial Sector: +3.7%
XLE U.S. Energy Sector: +3.6%
XLP U.S. Consumer Staples Sector: +3.5%
XLK U.S. Technology Sector: +3.0%
SOX Semiconductor Index: +1.7%
XLV U.S. Health Care Sector: -0.7%
IYT Dow Jones Transports: -3.1%
XRT U.S. Retail Industry: -5.1%
XLY U.S. Consumer Disc Sector: -5.4%
Week of 6/16/2025:
Click link for complete Economic Calendar.
United States - retail sales and industrial production.
United Kingdom - inflation.
Germany - ZEW economic sentiment index.
China - industrial production and retail sales.
Japan - trade data.
Monetary policy decisions from Central Banks: The Federal Reserve, People’s Bank of China, Bank of Japan, Bank of England, Switzerland, Sweden, Norway, Turkey, Brazil, Indonesia, the Philippines, and Taiwan.
Market Analysis
Keep reading with a 7-day free trial
Subscribe to PalmaFutures Newsletter to keep reading this post and get 7 days of free access to the full post archives.