


Sunday Post - Recap & Week Ahead 4/13/2025

NOTE: Free subscribers will continue to receive the weekly Sunday Post, but it will not include the final section with the chart, key levels, and detailed analysis for the upcoming week. Upgrade to a paid subscription to unlock the full Sunday Post and gain exclusive access to subscriber-only daily game plans.
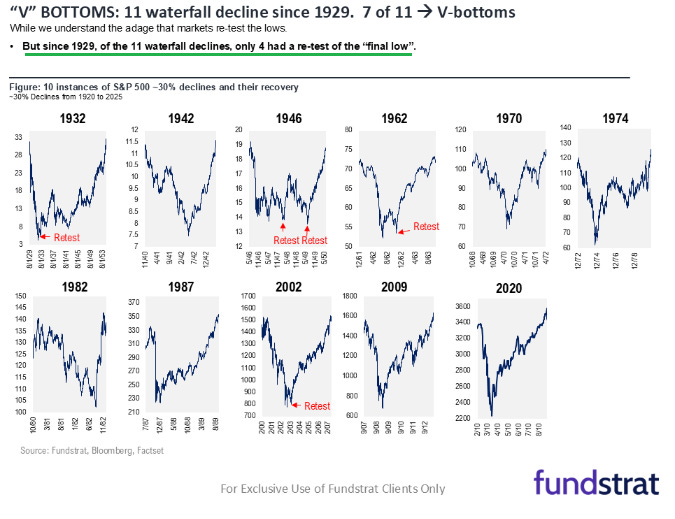
This week was marked by a robust recovery across major US indexes: the Nasdaq surged more than 7%, the S&P 500 rallied nearly 6%, and the Dow Jones gained about 5%. However, despite these impressive gains, the market has not fully recovered from the previous week’s losses—a reminder of the persistent volatility and the challenges that still lie ahead. On Tuesday, the S&P 500 came close to entering a Bear market, with its closing level putting the index 19% below its February high. By Friday’s close, the S&P 500 had recovered somewhat but still ended the week 12.7% below its all-time high. Interestingly, the index bounced off around the April 2024 lows and also found support at the lower bound of the upward channel that began at the March 2020 low—a level I highlighted in last week’s Sunday Post as a critical support zone. The lingering question now is whether this marks a true bottom or if the market will revisit these levels in a future re-test. The image below shows all the significant bottoms formed since 1929 (also, add the October 2022 bottom).
h/t: Fundstrat
The ES market found a bottom precisely at the downward channel support stemming from the February high, as shown in the daily chart below. The index then surged over 9.5% on Wednesday, marking its largest single-day gain since 2008. It is now approaching the downward channel resistance, which could serve as a significant barrier to further upside. Additionally, note that the daily 50 MA has now crossed below the 200 MA—a bearish technical signal.

As usual, I will do a brief recap of this week´s market action, followed by an analysis of the general markets and the various sectors, and conclude with an outlook for the upcoming week.
Recap:
Once again, the ES market began the week with a gap down at the Sunday evening open. All the downside targets for the week were met early on, as outlined in last week’s Sunday Post. The market then rebounded sharply and consolidated within a wide range. Wednesday brought a massive thrust to the upside, during which all upside targets for both the day and the entire week were achieved. As highlighted in the previous Sunday Post, a relief rally was anticipated based on the contrarian indicators shared in that edition. The market advanced toward the March low and approached the declining daily 20 MA. However, this area was rejected, triggering a sharp selloff that erased more than half of the previous day’s gains. Despite the pullback, the market managed a modest recovery with a small comeback on Friday. The ES is still trading within a downward channel, and volatility remains at extreme levels.
General Markets and Sectors:
Check out the updated Charts Page which goes with this section.
The S&P 500 initially sold off to the downward channel support from the February high. This area also coincides with the April 2024 lows, the December 2021/January 2022 highs and the upward channel support from the March 2020 low. As expected, the market bounced off this area and rallied sharply to the 5451 resistance, which is near the March low.
The NDX/Nasdaq initially sold off toward the January 2024 lows and the December 2021/January 2022 highs. Then rallied sharply toward the downward channel resistance from the February high.
The Dow Jones initially sold off to the downward channel support which coincides with the December 2021/January 2022 highs. It did break below the upward channel support from the March 2020 low but then rallied sharply and moved back inside this long-term upward channel. It is now trading at the 40000-resistance area.
Small Caps (IWM) initially sold off to the downward channel support from the November 2024 high, near the 172.50 support level. After some consolidation, it rebounded to the 189-resistance level, followed by a selloff to the 179 support, which held.
The FFTY index sold off to the key 24-support level and after some consolidation rebounded back higher.
The $VIX fell sharply to the 36 level which was defended. It remains Bullish and is in the extreme volatility territory.
Crude Oil sold off to the $58 support, which was briefly broken before rebounding higher. Resistance is at $67 and next support is at $51. It is trading inside the downward channel from the March 2022 high.
Gold initially sold off to the 2939 support/daily 50 MA, which held and then rebounded sharply, breaking above the upward channel resistance from the February 2024 low. It has made more new record highs and is very Bullish.
The US 10-Year yield bounced off the 3.90% support and rallied sharply, breaking above the 4.21% resistance/daily 200 MA and the 50 MA (now supports). Then moved higher to the 4.57% resistance, which was rejected and the 4.40% support held. It is approaching the downward channel resistance from the October 2023 high, which aligns with the 4.75% level.
The USDJPY broke below the upward channel support from the January 2021 low, around the 145-support level. It bounced off the 141.75 support, which is near the September 2024 lows.
Bitcoin continues to consolidate between the 76560 support and the 87300 resistance. It remains inside the upward channel from the October 2023 low and has approached the downtrend line from its all-time high (also daily 50 MA).
Semis, SOX bounced off the downward channel support from the July 2024 high and rose sharply to the March low, which got rejected.
Consumer Disc, XLY broke below the upward channel support from the December 2022 low but then rose sharply moving back inside this channel.
The Retail sector, XRT consolidated in a wide range near the downward channel support from the December 2024 high.
The Tech sector, XLK extended its losses to the October 2023 highs but then rebounded sharply to the March low, which got rejected.
Transports, IYT rebounded sharply and moved back inside the upward channel from the October 2022 low. However, after some selloff the market is now flirting with this channel support.
Financials sector, XLF initially sold off further down to the March/May 2024 highs and then rose sharply to the daily 200 MA, which got rejected. It is currently near the January low.
The Materials sector, XLB bounced off the downward channel support from the October 2024 high and rose sharply to the February 2024 low.
Industrials, XLI bounced off the upward channel support from the March 2020 low and rose sharply to the May 2024 highs.
The Health sector, XLV initially sold off to the downward channel support from the September 2024 high and then rebounded sharply. Currently in a wide ranged consolidation.
Consumer Staples, XLP initially broke below the upward channel support from the October 2023 low, but then rebounded sharply, moving back inside the channel, right to the daily 200 MA/50 MA.
Utilities, XLU has been rangebound since January and broke below the lower boundary of this range but then rebounded sharply moving inside this range. It is now trading below the daily 200 MA and the upward channel support from the October 2023 low that was broken last week.
The Energy sector, XLE has been rangebound for over two years (shaded area) and sold off to the lower boundary of this range. For now, it is consolidating in a wide range around this area.
YEAR-TO-DATE RETURN:
DJIA Dow Jones -5.0%
SPX S&P 500 -8.5%
IXIC Nasdaq -13.2%
XLP U.S. Consumer Staples Sector: +2.8%
XLU U.S. Utilities Sector: +1.5%
XLV U.S. Health Care Sector: -0.1%
XLF U.S. Financial Sector: -3.1%
XLB U.S. Materials Sector: -3.9%
XLI U.S. Industrials Sector: -4.3%
XLE U.S. Energy Sector: -7.2%
IYT Dow Jones Transports: -12.2%
XLK U.S. Technology Sector: -14.5%
XLY U.S. Consumer Disc Sector: -15.2%
XRT U.S. Retail Industry: -16.5%
SOX Semiconductor Index: -20.5%
Week of 4/14/2025:
Click link for complete Economic Calendar.
Unites States - retail sales and industrial production. Also, US earnings with major financial institutions including Goldman Sachs, Bank of America, and Citigroup set to report, alongside Johnson & Johnson, Abbott Laboratories, American Express, Blackstone, UnitedHealth Group, and Netflix.
China - Q1 GDP growth figures.
Germany - ZEW economic sentiment index.
United Kingdom - inflation and labor market data.
CPI report - Japan and India.
Meanwhile, several major central banks are scheduled to announce policy decisions, including the European Central Bank, Bank of Canada, Central Bank of Turkey, and Bank of Korea.
Keep reading with a 7-day free trial
Subscribe to PalmaFutures Newsletter to keep reading this post and get 7 days of free access to the full post archives.