


Sunday Post - Recap & Week Ahead 3/16/2025

NOTE: Free subscribers will continue to receive the weekly Sunday Post, but it will not include the final section with the chart, key levels, and detailed analysis for the upcoming week. Upgrade to a paid subscription to unlock the full Sunday Post and gain exclusive access to subscriber-only daily game plans.
The past week was marked by significant volatility across major US stock indices, leading to further declines. Investor sentiment was rattled by a sharp pullback, with the S&P 500 slipping into correction territory—down 10% from its recent peak—while the Nasdaq suffered even steeper losses, falling as much as 14% at its low. While the S&P 500 entered a correction, small-cap stocks fared even worse. The Russell 2000 Index, a key benchmark for smaller companies, came close to bear market territory, finishing the week down more than 16% from its recent high in November 2024. This marked the fourth consecutive weekly decline for the S&P 500, Nasdaq, and Russell 2000.
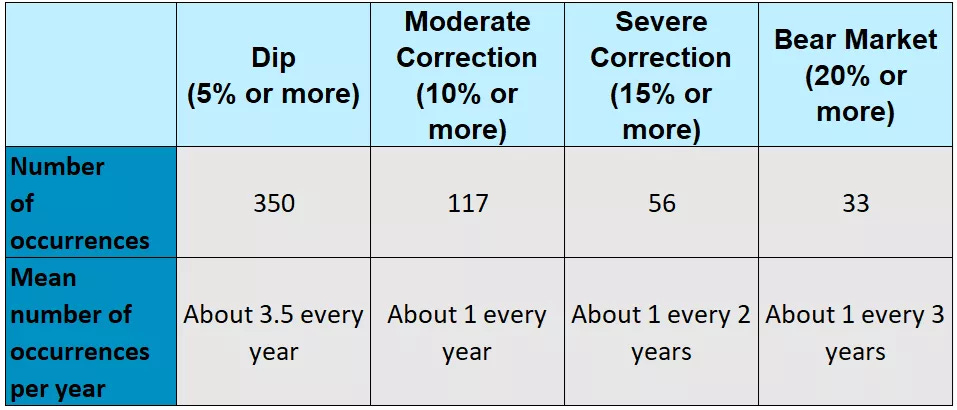
However, pullbacks like these are a normal part of market cycles. Historically, in any given year, the S&P 500 experiences one to three corrections in the 5% to 15% range. The table below illustrates the frequency of 5%, 10%, 15%, and 20% declines in the S&P 500 per calendar year since 1928.
h/t: Edward Jones
Meanwhile, gold surged to a new all-time high on Friday morning, briefly surpassing the $3,000-per-ounce level for the first time. Despite the sharp selloff in US equities, some areas of the financial markets have held up better—and even posted gains for the year. Within US stocks, value and cyclical sectors have outperformed technology and AI stocks. Bonds have broadly outperformed equities as investors sought safety, and several international markets, including those in Europe and China, have climbed 8%-10% YTD.
With respect to the ES futures market (ESM2025), this week’s declines extended further to the September lows, but Friday’s rally helped establish a new 4-Day Balance. See the daily chart below. There is a strong possibility of a relief bounce from here. That said, while market sentiment, breadth, and seasonality suggest a potential bottom, it’s too soon to be certain. As short-term traders, we assess market conditions day by day and adjust accordingly.

As usual, I will do a brief recap of this week´s market action, followed by an analysis of the general markets and the various sectors, and conclude with an outlook for the upcoming week.
Recap:
The Bearish scenario outlined in the prior Sunday Post unfolded early in the week, with all downside targets reached. In the following days, losses extended further until the market finally found a bottom on Thursday, leading to a strong rally on Friday. As mentioned above, the market is now in a 4-Day Balance, covering a broad range of nearly 170 points.
General Markets and Sectors:
Check out the updated Charts Page which goes with this section.
The S&P 500 broke below the daily 200 MA (5762 level) and the 5638-support level (now resistances). It found bottom at a long-term support trendline near the 5451 support, followed by a move back higher to the 5638 level.
The NDX/Nasdaq broke below the upward channel support from the January 2023 low and moved briefly below the 19470 support. It has now back-tested the channel and a move back inside the channel would be quite Bullish.
The Dow Jones broke below the 41915 support and the daily 200 MA (now resistances) early in the week. The 41198 support was then broken but was reclaimed on Friday.
Small Caps (IWM) consolidated around the 200-support level which coincides with the downward channel support from the November high. A bounce is possible, and next resistance is at the 212 level.
The FFTY index broke below the upward channel support from the October 2023 low early in the week, but this zone was reclaimed with the market moving back inside the channel.
The $VIX sold off sharply and is getting closer to the 20 level. It remains Bullish, but that can change fairly quickly.
Crude Oil consolidated around the $67 support, which held several times last fall of 2024. It has moved back inside the downward channel from the March 2022 high. Next support is at $58.
Gold broke above the 2939 resistance (now support) and made a new all-time record high, near a long-term resistance trendline. It remains in an upward channel from the February 2024 low.
The US 10-Year yield was able to defend the 4.21% support/daily 200 MA once again, which aligns with the back-test of the downward channel from the October 2023 high. If this area holds, next resistance is at 4.40%, if not, next support is at 4.0%.
The USDJPY consolidated below the 150 - 148.50 resistance area. Next support is at 145, which aligns with the upward channel support from the January 2021 low.
Bitcoin broke below the daily 200 MA and the 80425 support. It bottomed right at the 76560 support and then moved higher to the daily 200 MA, which is acting as resistance. It remains inside the upward channel from the October 2023 low.
Semis, SOX broke below the upward channel support from the October 2022 low and then this area was reclaimed. There could be a potential bounce.
Consumer Disc, XLY broke below the daily 200 MA and found support at the October low. It remains in the gradual upward channel from the December 2022 low.
The Retail sector, XRT continued to move lower and looks like it is finding support around the January 2024 low. Note the daily 50 MA crossing below the 200 MA.
The Tech sector, XLK sold off further down and consolidated near the September lows.
Transports, IYT broke below the uptrend line from the October 2023 low. It remains in the upward channel from the October 2022 low.
Financials sector, XLF sold off further down and then consolidated near the January lows, right above the daily 200 MA.
The Materials sector, XLB sold off to the upward channel support from the October 2022 low which was defended.
Industrials, XLI broke below the daily 200 MA. It remains in an upward channel from the March 2020 low.
The Health sector, XLV broke below the daily 200 MA and moved lower to the 50 MA which is being defended. This market has been rangebound since late January.
Consumer Staples, XLP sold off from the November/December highs and broke below the daily 200 MA/50 MA. It remains in an upward channel from the October 2023 low.
Utilities, XLU defended the upward channel support from the October 2023 low (also daily 200 MA) and then rallied higher moving back above the 50 MA.
The Energy sector, XLE moved higher to the daily 200 MA/50 MA. Note that this market has been rangebound for over two years (shaded area).
YEAR-TO-DATE RETURN:
DJIA Dow Jones -2.1%
SPX S&P 500 -3.9%
IXIC Nasdaq -7.9%
XLV U.S. Health Care Sector: +5.3%
XLE U.S. Energy Sector: +4.8%
XLU U.S. Utilities Sector: +4.2%
XLB U.S. Materials Sector: +2.2%
XLP U.S. Consumer Staples Sector: +1.1%
XLF U.S. Financial Sector: +0.4%
XLI U.S. Industrials Sector: -0.5%
IYT Dow Jones Transports: -4.4%
XLK U.S. Technology Sector: -8.0%
SOX Semiconductor Index: -8.5%
XLY U.S. Consumer Disc Sector: -12.3%
XRT U.S. Retail Industry: -15.2%
Week of 3/17/2025:
Click link for complete Economic Calendar.
United States - Federal Reserve's interest rate decision, retail sales, industrial production, and housing market indicators, including housing starts, building permits, and existing home sales.
Interest Rate decisions - Japan, China, the UK, Brazil, Switzerland, and Sweden.
Inflation data - Canada and Japan.
China - retail sales, industrial production, house price index, and fixed asset investments.
United Kingdom - unemployment rate and GfK consumer confidence.
Germany - ZEW economic sentiment.
Euro Area - consumer confidence.
New Zealand - GDP growth rate.
Canada - retail sales.
Keep reading with a 7-day free trial
Subscribe to PalmaFutures Newsletter to keep reading this post and get 7 days of free access to the full post archives.