


Sunday Post - Recap & Week Ahead 5/4/2025

PLEASE SEE INTRO POST AND READ DISCLAIMER & INTELLECTUAL PROPERTY SECTIONS
NOTE: Free subscribers will continue to receive the weekly Sunday Post, but it will not include the final section with the chart, key levels, and detailed analysis for the upcoming week. Upgrade to a paid subscription to unlock the full Sunday Post and gain exclusive access to subscriber-only daily game plans.
Wall Street extended its rally into the final week of April and early May, with all three major indexes finishing solidly higher. The S&P 500 gained approximately 2.9%, the Dow Jones rose around 3.0%, and the Nasdaq advanced roughly 3.4% for the week. For the S&P 500, Friday’s move marked its ninth consecutive daily gain—its longest winning streak since 2004. The Dow Jones and Nasdaq also hit fresh multi-week highs, lifted by broad-based strength across sectors. This week’s gains built on the prior week’s momentum and sharply contrasted with the volatility that defined much of April. By mid-month, the S&P 500 was more than 15% below its year-to-date highs, but the selloff quickly reversed. April ultimately ended with the index down just 0.8%.
Since late March, I’ve consistently outlined the case for a potential market bottom or reversal and offered cautious but actionable guidance for readers.
In the 3/30 Sunday Post, I noted:
“From an Elliott Wave perspective, the current structure suggests that the market may be completing a fifth wave down in an ongoing correction from its December all-time high. If this wave count holds, a potential reversal or relief rally could be on the horizon.”
In the 3/31 Post, I wrote:
“Short exposure is significantly high—exceeding levels seen during the COVID years, as shown in the graph below. Market breadth has also deteriorated over the past week. With all this negativity and the stock markets being oversold, could a potential reversal be on the horizon?”
In the 4/6 Sunday Post, I pointed to the $VIX surging past 45:
“This level typically reflects extreme fear or uncertainty in the market and is often associated with capitulation-style selling. Historically, however, such spikes in the $VIX have been reliable contrarian indicators, signaling major market bottoms or pivotal turning points.”
Also, in the 4/6 Sunday Post, I shared one of the most reliable signals for long-term investing in my experience:
“With respect to market breadth, the percentage of stocks trading above their daily 200 MA is nearing zones that have typically aligned with major market bottoms.”
In the 4/7 Post, I reiterated that extreme Bearish sentiment, weak market breadth, and elevated $VIX levels have historically coincided with major market bottoms or pivotal turning points—and shared another signal:
“Below is the chart of the Insider Transaction Ratio, which has shifted into Bullish territory in April. This ratio tracks buying and selling activity by corporate insiders, and the recent move suggests growing confidence among them.”
Lastly, in the 4/14 Post, I discussed how market bottoms typically unfold in stages, reflecting shifts in sentiment, investor behavior, and broader economic signals. Recognizing these stages is key—and it’s equally important not to let “media noise” or “popular narratives” override your own analysis and discipline.
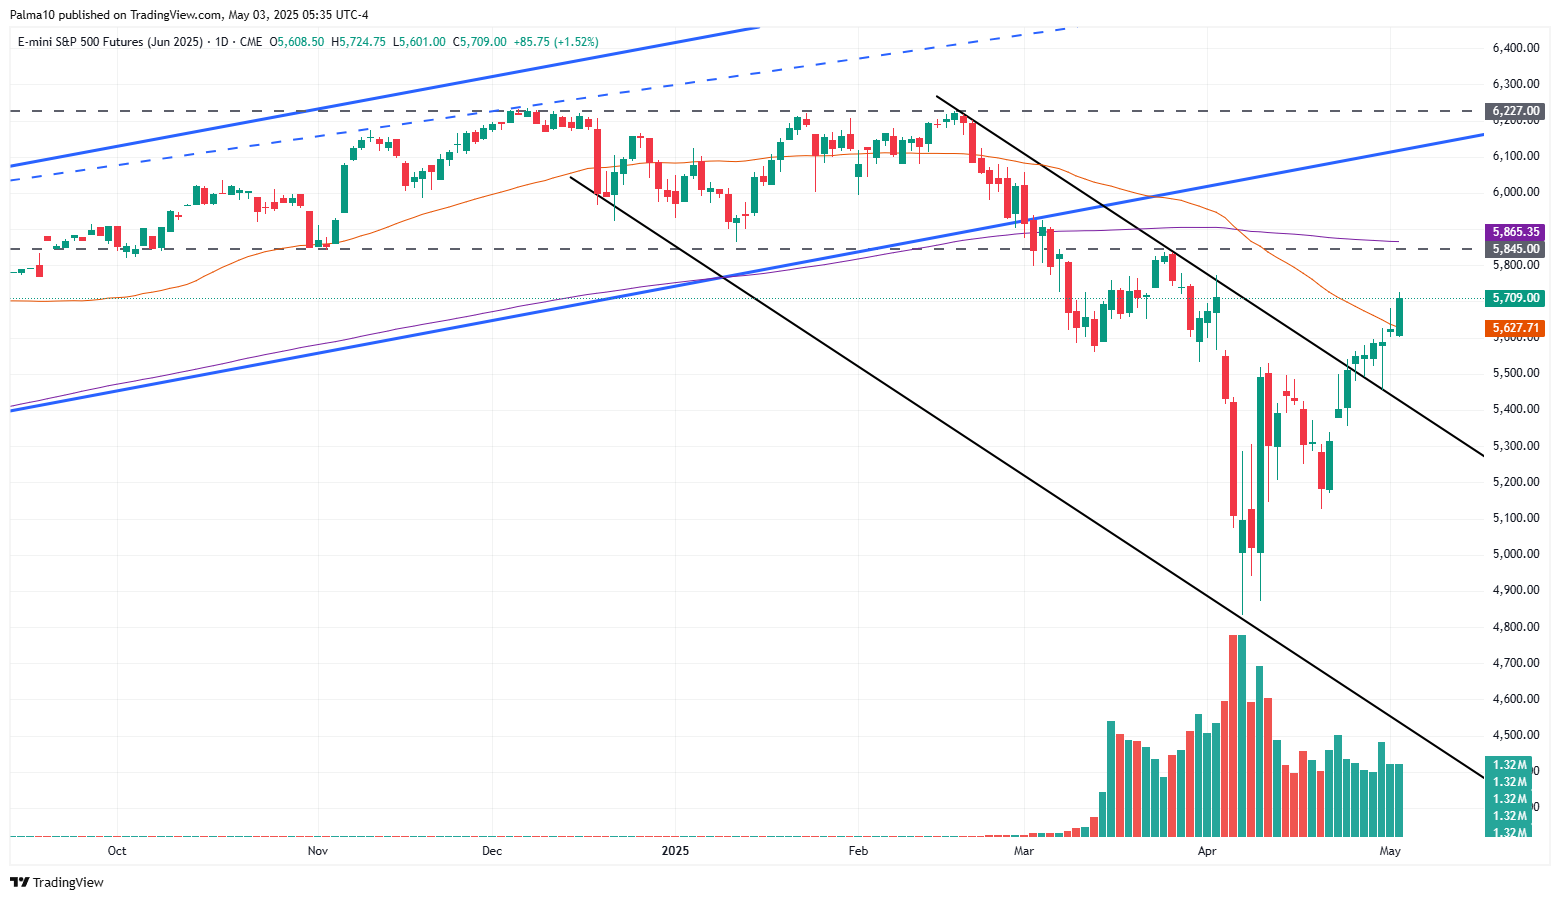
I hope these insights have served subscribers well—particularly swing traders and for long-term investing. As the daily chart below shows, the ES market has now broken out of the downward channel from the February high and reclaimed the daily 50 MA—two key Bullish developments. That said, strong overhead resistance remains near the 5845 area and the daily 200 MA. The market could reach this zone quickly, but what happens afterward remains uncertain.
As usual, I will do a brief recap of this week´s market action, followed by an analysis of the general markets and the various sectors, and conclude with an outlook for the upcoming week.
Recap:
The ES market started the week by defending the top of the prior 10-Day Balance area—a key condition for the Bullish scenario outlined in the prior Sunday Post. Early on, the Buyers struggled to gain traction and failed to push through the first upside target, while the Sellers similarly fell short of breaking the first downside target. This led to a period of consolidation between those key levels. Midweek, the market broke lower sharply on Wednesday, but the move turned out to be a failed breakdown of a key support area mentioned in the plan. Price quickly reversed and the Buyers stepped in with conviction, driving a strong intraday rally. The Bullish momentum continued into Thursday, with the market reclaiming the daily 50 MA. However, selling pressure emerged late in the session, resulting in a Bearish reversal day and a close back below the 50 MA. On Friday, the Buyers reasserted control. The rally resumed, the 50 MA was reclaimed again, and the market pushed up to reach the second-to-last upside target outlined in last week’s analysis. All in all, the Bullish weekly scenario laid out in the prior Sunday Post played out exceptionally well.
General Markets and Sectors:
Check out the updated Charts Page which goes with this section.
The S&P 500 back-tested the downward channel (5451 support level) after breaking the channel resistance and then rallied higher, pushing above key resistances - the 5550 level and daily 50 MA (now supports). It is approaching the daily 200 MA and the 5762 resistance.
The NDX/Nasdaq defended the 18925 support and then rallied higher breaking above the daily 50 MA (19470 level). It has now reached the daily 200 MA.
The Dow Jones defended the 40000 support level and then rallied higher breaking the downward channel from mid-February. It was able to close above the 41198 resistance level and reach the daily 50 MA.
Small Caps (IWM) consolidated above the 189 support level and then rallied to the 200 resistance level/daily 50 MA. It remains in the downward channel from the November 2024 high.
The FFTY index managed to move back inside the upward channel from the October 2023 low and close above the daily 50 MA. It is now approaching the 200 MA.
The $VIX continued to decline, moving toward the 20 level, which reflects a generally Bullish environment for equities. However, it may be oversold in the short term, potentially setting up for a bounce.
Crude Oil sold off to the $58 support once again and is quite Bearish. If this area holds, it faces overhead resistances at the $67 level, daily 50 MA and the downward channel resistance from the March 2022 high. Next support is at $51.
Gold sold off and broke below the 3288 support (now resistance). It remains Bullish and next support is at 3138 (back-test of upward channel from February 2024 low).
The US 10-Year briefly broke below the 4.21% support/daily 200 MA and then rallied higher closing above the 50 MA. Next resistance is at 4.40% and remains in the downward channel from the October 2023 high.
The USDJPY defended the 141.75 support and then rallied to the 145 resistance. It is approaching the back-test of the upward channel from the January 2021 low and the daily 50 MA.
Bitcoin defended the 92500 support and moved slightly higher. It remains within the upward channel from the October 2023 low.
Semis, SOX rallied and moved above the daily 50 MA after some consolidation. Let´s see if this holds. It remains in the downward channel from the July 2024 high.
Consumer Disc, XLY also moved above the daily 50 MA and as mentioned last week, it is back inside the upward channel from the December 2022 low.
The Retail sector, XRT moved higher to the 70.60 resistance level and closed above the daily 50 MA. It remains in the downward channel from the December 2024 high.
The Tech sector, XLK gapped up and reclaimed the daily 50 MA after some consolidation. Next resistance is at the 200 MA.
Transports, IYT defended the upward channel support from the October 2022 low and then rallied to the daily 50 MA.
Financials sector, XLF defended the daily 200 MA and then broke the downtrend line/daily 50 MA. On Friday, it gapped up higher toward the April high.
The Materials sector, XLB gapped up and moved above the daily 50 MA. It remains in the downward channel from the October 2024 high.
Industrials, XLI moved higher and reclaimed both the daily 50 MA and 200 MA. It remains in the upward channel from the March 2020 lows.
The Health sector, XLV has been consolidating for the past month within the downward channel from the September 2024 high.
Consumer Staples, XLP continues to consolidate around the daily 200 MA/50 MA and is within the upward channel from the October 2023 low.
Utilities, XLU defended the upward channel support from the October 2023 low, as well as the daily 200 MA/50 MA, and then rallied higher.
The Energy sector, XLE has been rangebound for over two years (shaded area) and is currently consolidating near the lower boundary of this range.
YEAR-TO-DATE RETURN:
DJIA Dow Jones -2.4%
SPX S&P 500 -2.9%
IXIC Nasdaq -6.7%
XLU U.S. Utilities Sector: +6.1%
XLP U.S. Consumer Staples Sector: +4.3%
XLF U.S. Financial Sector: +3.3%
XLI U.S. Industrials Sector: +2.4%
XLB U.S. Materials Sector: +1.4%
XLV U.S. Health Care Sector: +1.1%
XLE U.S. Energy Sector: -3.6%
IYT Dow Jones Transports: -6.4%
XLK U.S. Technology Sector: -6.7%
XLY U.S. Consumer Disc Sector: -10.0%
XRT U.S. Retail Industry: -11.1%
SOX Semiconductor Index: -12.5%
Week of 5/5/2025:
Click link for complete Economic Calendar.
United States - Federal Reserve’s interest rate decision, the ISM Services PMI and foreign trade figures. Also, remarks from Fed officials, alongside a wave of Q1 earnings reports.
Interest Rate decisions - UK, Brazil, Poland, and Norway.
Inflation data - Switzerland, Turkey, the Philippines, Mexico, and Brazil.
Canada - labour market report and trade balance figures.
Additional trade data - China, France, Germany, Brazil, and Canada.
Germany - factory orders and industrial production numbers.
China - services PMI and new yuan loans.
Market Analysis
Keep reading with a 7-day free trial
Subscribe to PalmaFutures Newsletter to keep reading this post and get 7 days of free access to the full post archives.